


30
11.2 Graph Analysis
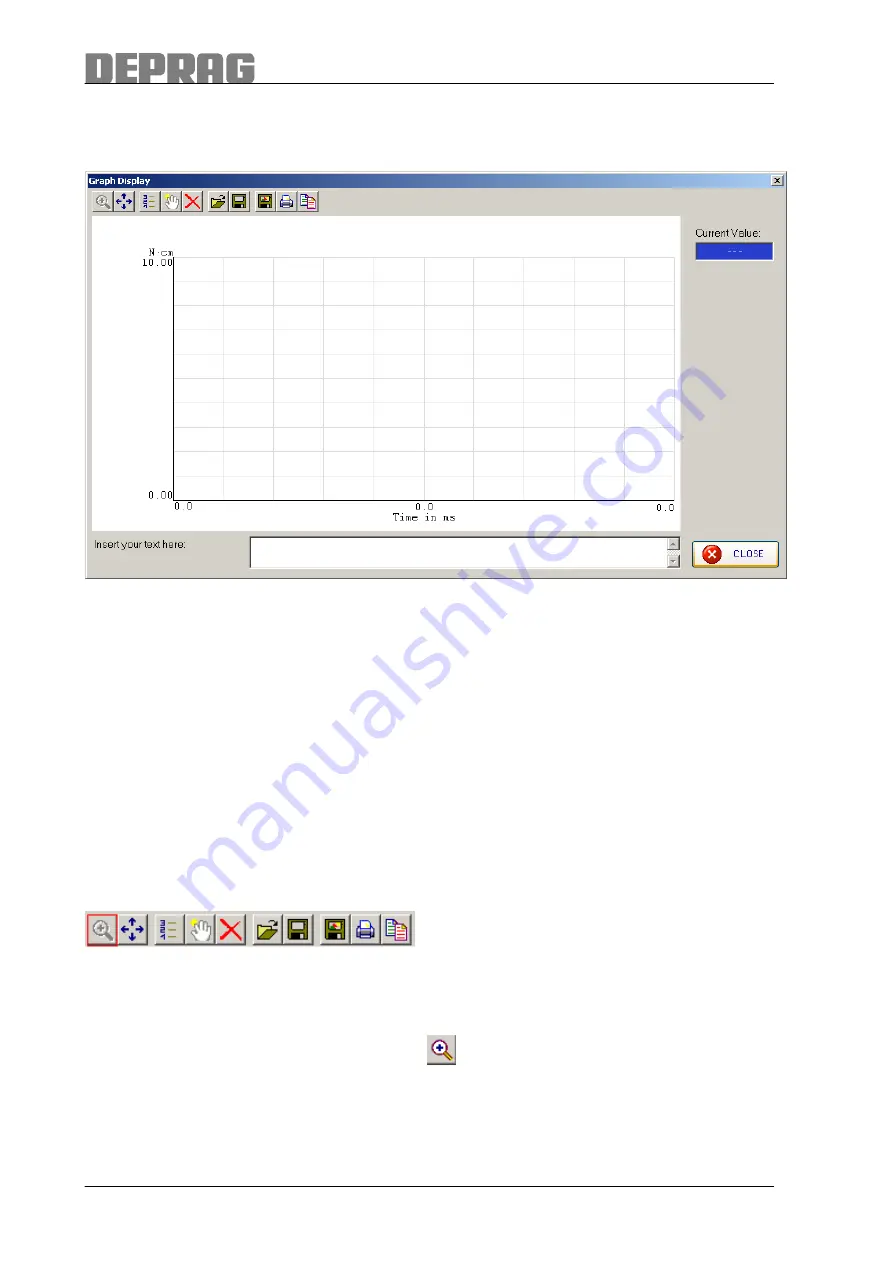
Click on SHOW GRAPH to open the window “Graph D
isplay”.
Picture 25: Graph display
In this window you can view the graph of the last measurement, save a graph or load a
saved graph. You can maximise the size of a displayed graph, set or delete markers,
save the graph as an image, print or copy it to the clipboard. The scale on the left-hand
side of the diagram can also be displayed. The original graph display can also be
retrieved. When a graph is displayed, the measurement value of the current cursor
position is shown in the field “Current Value”.
In the text box a comment can be added to the current measurement graph.
Click on CLOSE to leave the graph display.
11.2.1 Zoom In Graph Display
The graph display can be zoomed in using the toolbar.
Picture 26: Magnify tool
After opening the graph display the zoom-in mode is automatically activated and
therefore the magnify tool button is displayed as grey. If the zoom-in tool button is not
displayed as grey then click on the symbol
to activate the zoom-in mode.
To enlarge a certain area of the graph, click with the left mouse button in the graph
display and whilst holding down the left mouse button, mark the area which you want to
enlarge. This area is displayed with a thinly dashed rectangle.