Page 32
High and Low Alarm Values:
The High and Low alarm values assigned to the
data source for each of the five displays (1, 2, 3, L, R) are shown in the Current
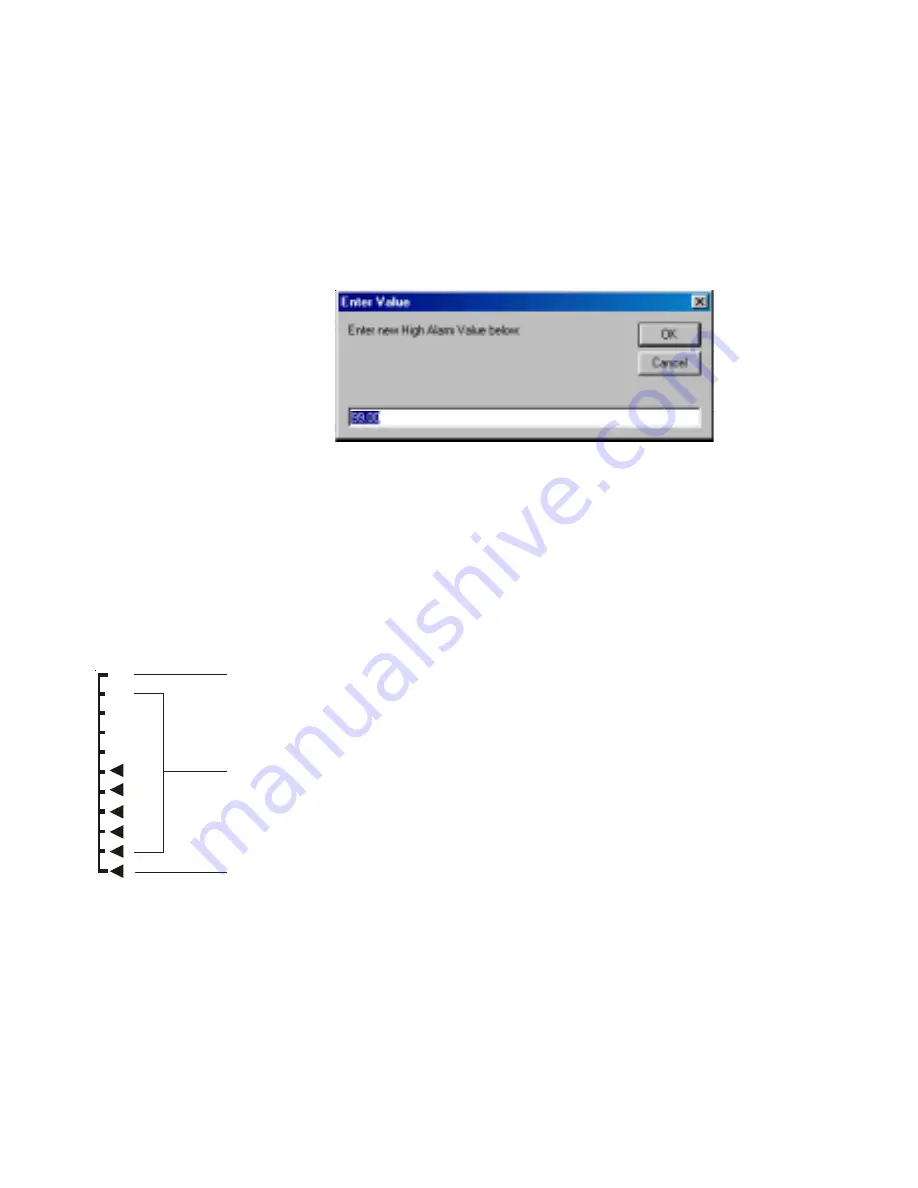
Display Configuration area with a “change” box next to each. Clicking the
“Change” box allows you to change the High and Low alarm limits as shown
below.
Be sure to read the warnings about alarms in the
Important Notes
and Warnings
section about which Data Sources and conditions will sound
an audible alarm
.
High and Low Limit Values for Bar Charts:
Similarly the High and Low
Limit values of the two bar charts are shown in the Current Display Configura-
tion area along with “Change” boxes. Clicking on the “Change” box allows you
to change the High and Low Limit values for the two bar charts. The high limit
is the value that displays at the top of the bar chart and the low limit is the value
that displays at the bottom of the bar chart.
A data source with a value equal to or greater than the High Limit
is shown here on the bar chart.
A data source with a value equal to or less than the Low Limit is
shown here on the bar chart.
A data source with a value between the Low Limit and High
Limit will be displayed in this area of the bar chart.
Selecting the High and Low Limit values appropriately allows you to scale the
data or “zoom” into the area of interest to you. For example if you direct the
battery voltage of a 12V battery to one of the bar charts you can set the Low
Limit value at 11.8 V and the High Limit value to 12.2V providing an expanded
scale for battery voltage. The High and Low Limit values are completely inde-
pendent of the high and low alarm limits.
Содержание MaxVu110
Страница 1: ...Page 1 CruzPro MaxVu110 User Configurable Multifunction Instrument...
Страница 10: ...Page 10 Figure 2 MaxVu110 Screw Terminal Connections...
Страница 12: ...Page 12...
Страница 35: ...Page 35...
Страница 46: ...Page 46 Appendix C Typical Setup...
Страница 47: ...Page 47...


