File name : CBM_SR-281N_IB_English_black_v09330.doc
Date: 2009/3/30 Trimmed Size : 140 x 75 mm SCALE 1 : 1
-E29-
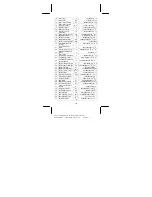
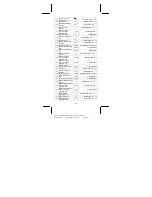
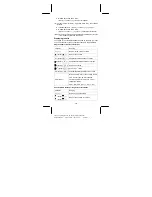
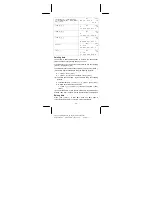
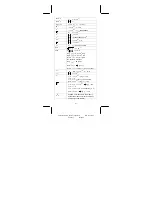
Sx
( [2nd]+[ Sx ] )
Sy
( [2nd]+[ Sy ] )
Sample standard deviation of x values or y
values
σ
x
( [2nd]+[
σ
x
] )
σ
y
( [2nd]+[
σ
y
] )
Population standard deviation of x values or
y values
∑
x
( [2nd]+[
∑
x
] )
∑
y
( [2nd]+[
∑
y
] )
Sum of all x values or y values
∑
x
2
( [2nd]+[
∑
x
2
])
∑
y
2
( [2nd]+[
∑
y
2
])
Sum of all x
2
values or y
2
values
∑
x y
Sum of ( x • y ) for all x-y pairs
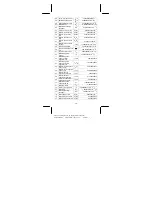
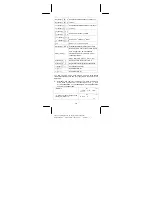
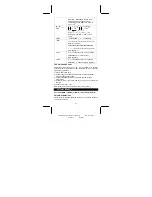
CP
( [2nd]+[
CP
] ) Potential capability precision of the x values
CPK ( [ CPK ] )
Minimum (CPU, CPL) of the x values, where
CPU is upper spec. limit of capability
precision and CPL is lower spec. limit of
capability precision
CPK = Min ( CPU , CPL ) = CP ( 1 – Ca )
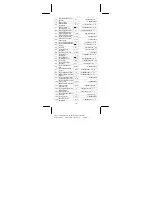
a ( [2nd]+[
a ] )
Regression formula constant term a
b ( [2nd]+[
b ] )
Regression formula regression coefficient b
r ( [2nd]+[
r ] )
Correlation coefficient r
x
’
([ x
’
] )
Estimated value of x
y
’
([ y
’
] )
Estimated value of y
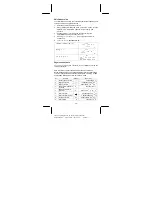
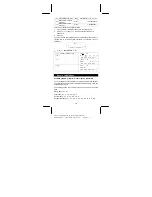
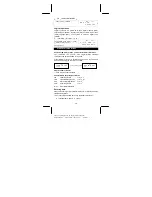
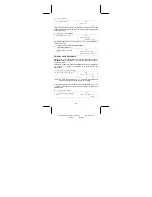
You also can add a new data anytime. The unit automatically
recalculates statistics each time you press [ DATA ] and enter a new
data value.
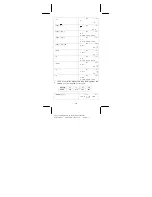
¾
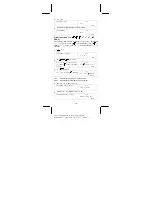
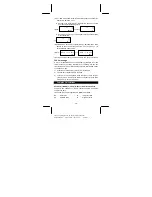
Enter data : USL
= 95, LSL = 70, DATA 1 = 75, DATA 2 = 85, DATA
3 = 90, DATA 4 = 82, DATA 5 = 77, then find out n = 5, = 81.8,
Sx = 6.05805249234,
σ
x = 5.41848687366, CP = 0.76897236513,
and CPK = 0.72590991268
DEG
STAT
1–
V A R
L I N
L O G
[ MODE ] 2
DEG
STAT
D A T A
5
[=] [ DATA ] 75 [ DATA ] 85 [ DATA ] 90
[ DATA ] 82 [ DATA ] 77
7 7

