


124
Chapter 7
Statistical Graphs and Calculations
(G-Type)
(Scat)
(XList)
(YList)
(Freq)
(M-Type)
(Auto)
(Pwr)
1
2
3
4
Example
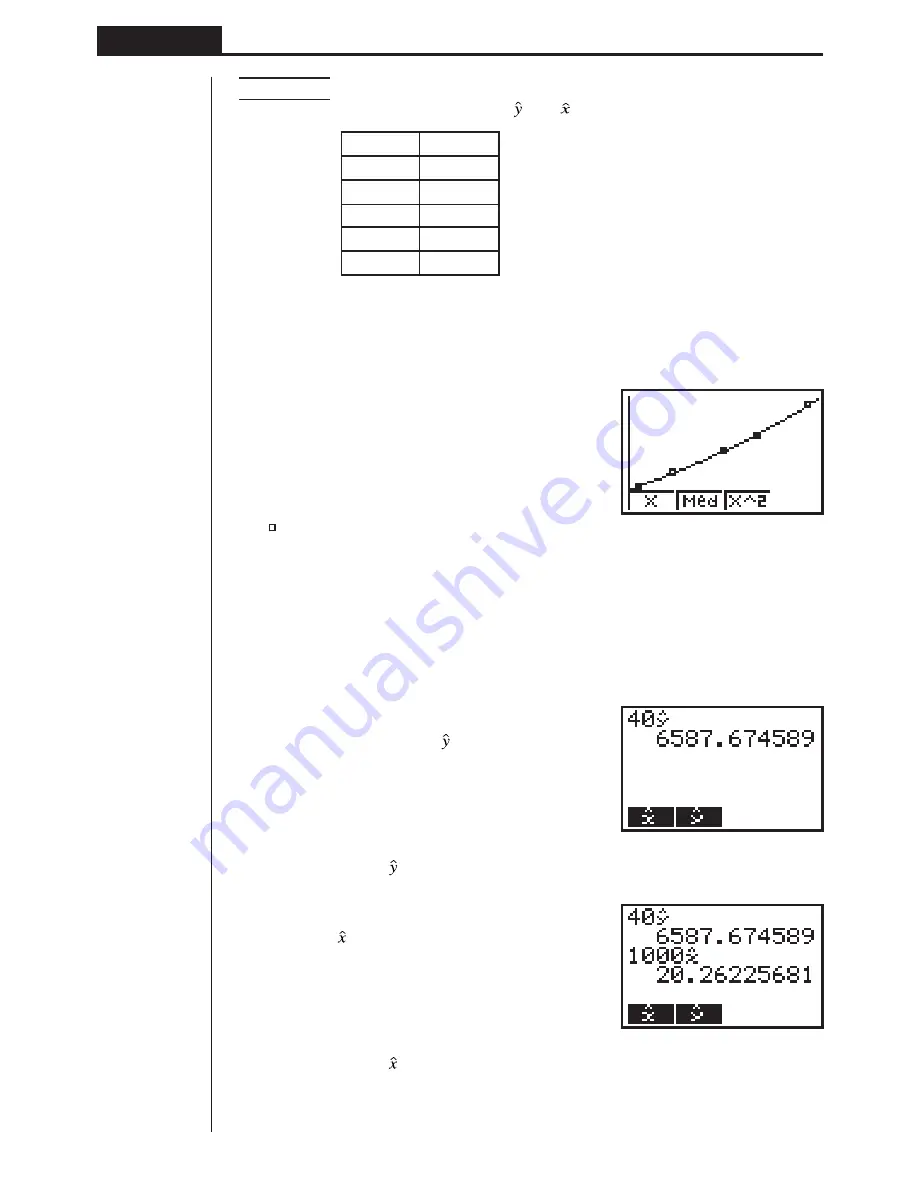
To perform power regression using the following data and
estimate the values of and when
xi
= 40 and
yi
= 1000
xi
(List 1)
yi
(List 2)
28
2410
30
3033
33
3895
35
4491
38
5717
1. In the Main Menu, select the
STAT
icon and enter the STAT Mode.
2. Input data into the list and draw the power regression graph.
1
(GRPH)
[
4
(SET)
c
1
(Scat)
c
1
(List1)
c
2
(List2)
c
1
(1)
c
1
( )
Q
!Z1
(Auto)
Q1
(GRPH)
1
(GPH1)
[
3
(Pwr)
4
(DRAW)
3. In the Main Menu, select the
RUN
icon and enter the RUN Mode.
4. Press the keys as follows.
ea
(value of
xi
)
K
3
(STAT)
2
( )
w
The estimated value is displayed for
xi
= 40.
baaa
(value of
yi
)
1
( )
w
The estimated value is displayed for
yi
= 1000.
Содержание fx-7400G PLUS
Страница 7: ... fx 7400G PLUS ...
Страница 14: ...xii Contents ...
Страница 57: ...Differential Calculations Chapter 3 ...
Страница 176: ...162 Chapter 8 Programming ...
Страница 188: ...Chapter 9 Data Communications 174 ...
Страница 199: ...185 1 2 3 4 5 Program for Circle and Tangents No 4 Step Key Operation Display ...
Страница 200: ...186 Program for Circle and Tangents No 4 Step Key Operation Display 6 7 8 9 10 ...
Страница 201: ...187 11 12 13 14 15 Program for Circle and Tangents No 4 Step Key Operation Display ...
Страница 202: ...188 16 17 18 Program for Circle and Tangents No 4 Step Key Operation Display ...
Страница 205: ...191 1 2 3 4 5 Program for Rotating a Figure No 5 Step Key Operation Display ...