


118
Chapter 7
Statistical Graphs and Calculations
k
k
k
k
k
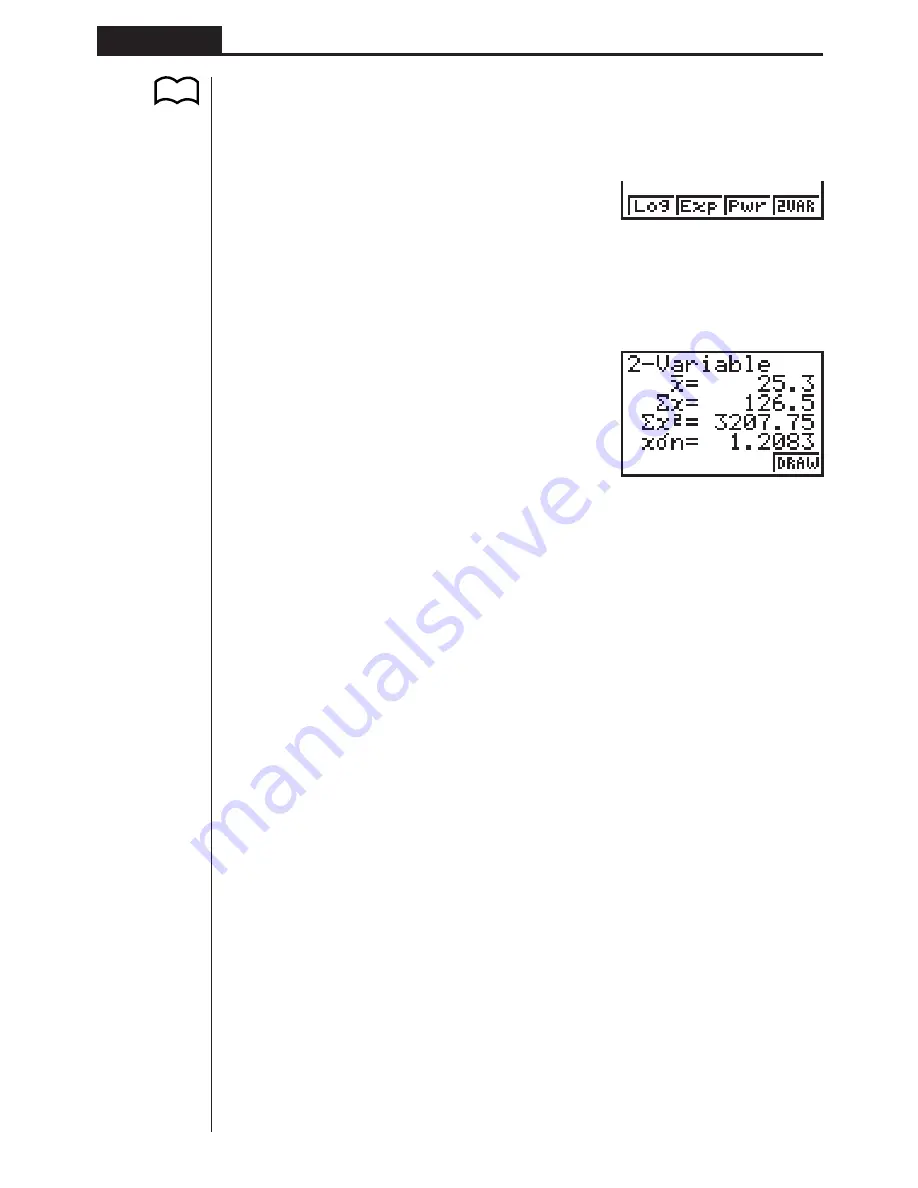
Displaying Paired-Variable Statistical Results
Paired-variable statistics can be expressed as both graphs and parameter values.
When these graphs are displayed, the menu at the bottom of the screen appears as
below.
[
4
(2VAR) ....... Paired-variable calculation result menu
Pressing
4
(2VAR) displays the following screen.
4
(2VAR)
• Use
c
to scroll the list so you can view the items that run off the bottom of the
screen. The following describes the meaning of each of the parameters.
_
x
...................... Mean of
x
List data
Σ
x
.................... Sum of
x
List data
Σ
x
2
.................. Sum of squares of
x
List data
x
σ
n
.................. Population standard deviation of
x
List data
x
σ
n
-1
................ Sample standard deviation of
x
List data
n
...................... Number of
x
List data items
_
y
...................... Mean of
y
List data
Σ
y
.................... Sum of
y
List data
Σ
y
2
.................. Sum of squares of
y
List data
y
σ
n
.................. Population standard deviation of
y
List data
y
σ
n
-1
................ Sample standard deviation of
y
List data
Σ
xy ..................
Sum of the product of data stored in
x
List and
y
List
minX ................ Minimum of
x
List data
maxX............... Maximum of
x
List data
minY ................ Minimum of
y
List data
maxY............... Maximum of
y
List data
k
k
k
k
k
Copying a Regression Graph Formula to the Graph Mode
After you perform a regression calculation, you can copy its formula to the
GRAPH
Mode
.
The following are the functions that are available in the function menu at the bottom
of the display while regression calculation results are on the screen.
P.106
1
2
3
4
Содержание fx-7400G PLUS
Страница 7: ... fx 7400G PLUS ...
Страница 14: ...xii Contents ...
Страница 57: ...Differential Calculations Chapter 3 ...
Страница 176: ...162 Chapter 8 Programming ...
Страница 188: ...Chapter 9 Data Communications 174 ...
Страница 199: ...185 1 2 3 4 5 Program for Circle and Tangents No 4 Step Key Operation Display ...
Страница 200: ...186 Program for Circle and Tangents No 4 Step Key Operation Display 6 7 8 9 10 ...
Страница 201: ...187 11 12 13 14 15 Program for Circle and Tangents No 4 Step Key Operation Display ...
Страница 202: ...188 16 17 18 Program for Circle and Tangents No 4 Step Key Operation Display ...
Страница 205: ...191 1 2 3 4 5 Program for Rotating a Figure No 5 Step Key Operation Display ...