


121
Statistical Graphs and Calculations
Chapter 7
2
(Man)
Q
(Returns to previous menu.)
1
(GRPH)
1
(GPH1)
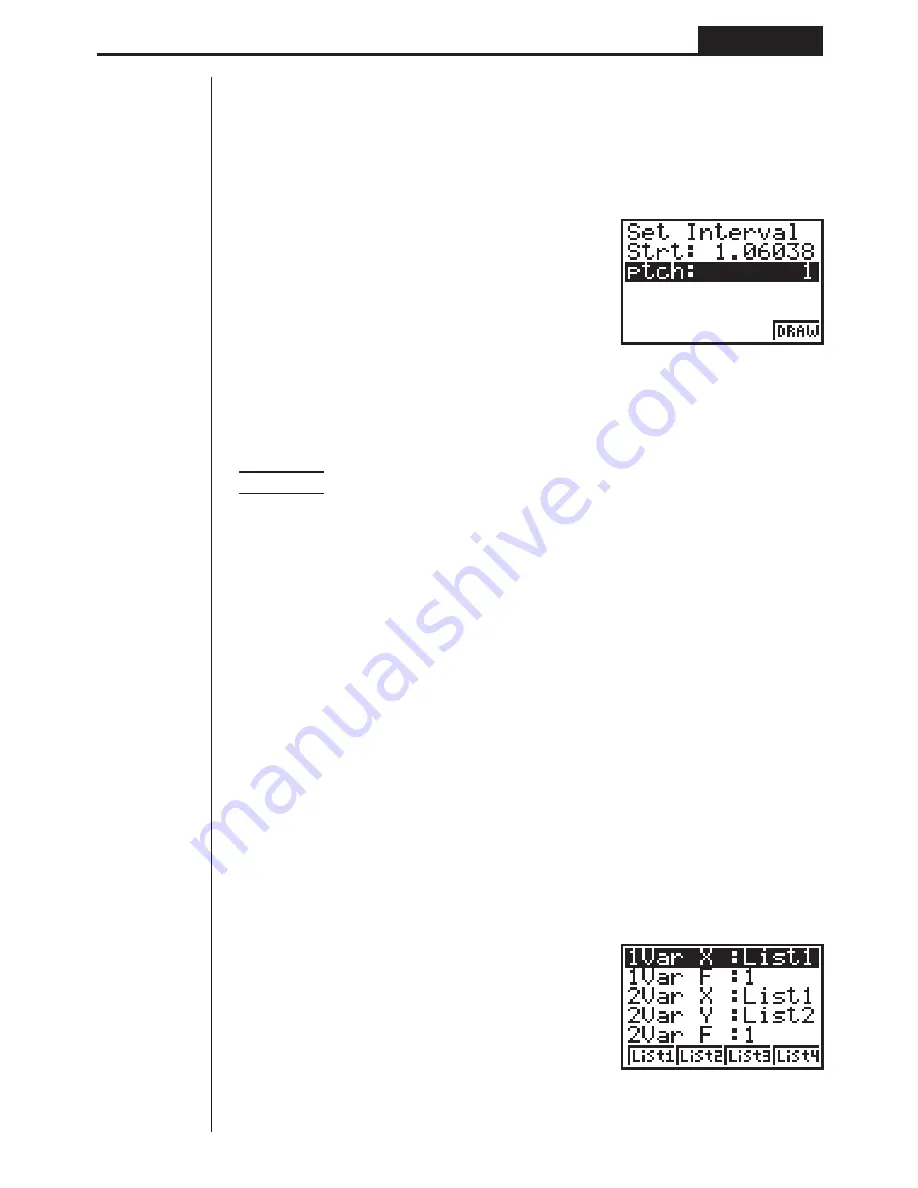
Here we will illustrate this operation by making histogram settings for Graph 1.
The following are the meanings of the items that appear in this screen.
Strt .................. Histogram start point (
x
-coordinate)
ptch ................. Bar spacing (specify as scale unit)
Example
Strt: 0, ptch: 10
While the statistical data list is on the display, perform the following procedure.
!Z2
(Man)
Q
(Returns to previous menu.)
1
(GRPH)
1
(GPH1)
a
w
(Start value is
x
= 0.)
ba
w
(pitch = 10)
6. Performing Statistical Calculations
All of the statistical calculations up to this point were performed after displaying a
graph. The following procedures can be used to perform statistical calculations alone.
u
u
u
u
u
To specify statistical calculation data lists
You have to input the statistical data for the calculation you want to perform and
specify where it is located before you start a calculation. While the statistical data is
on the display, perform the following procedure.
2
(CALC)
4
(SET)
Содержание fx-7400G PLUS
Страница 7: ... fx 7400G PLUS ...
Страница 14: ...xii Contents ...
Страница 57: ...Differential Calculations Chapter 3 ...
Страница 176: ...162 Chapter 8 Programming ...
Страница 188: ...Chapter 9 Data Communications 174 ...
Страница 199: ...185 1 2 3 4 5 Program for Circle and Tangents No 4 Step Key Operation Display ...
Страница 200: ...186 Program for Circle and Tangents No 4 Step Key Operation Display 6 7 8 9 10 ...
Страница 201: ...187 11 12 13 14 15 Program for Circle and Tangents No 4 Step Key Operation Display ...
Страница 202: ...188 16 17 18 Program for Circle and Tangents No 4 Step Key Operation Display ...
Страница 205: ...191 1 2 3 4 5 Program for Rotating a Figure No 5 Step Key Operation Display ...