101
Statistical Graphs and Calculations
Chapter 7
1
2
3
4
[
1
2
3
4
[
1
2
3
4
[
1
2
3
4
[
1
2
3
4
[
[
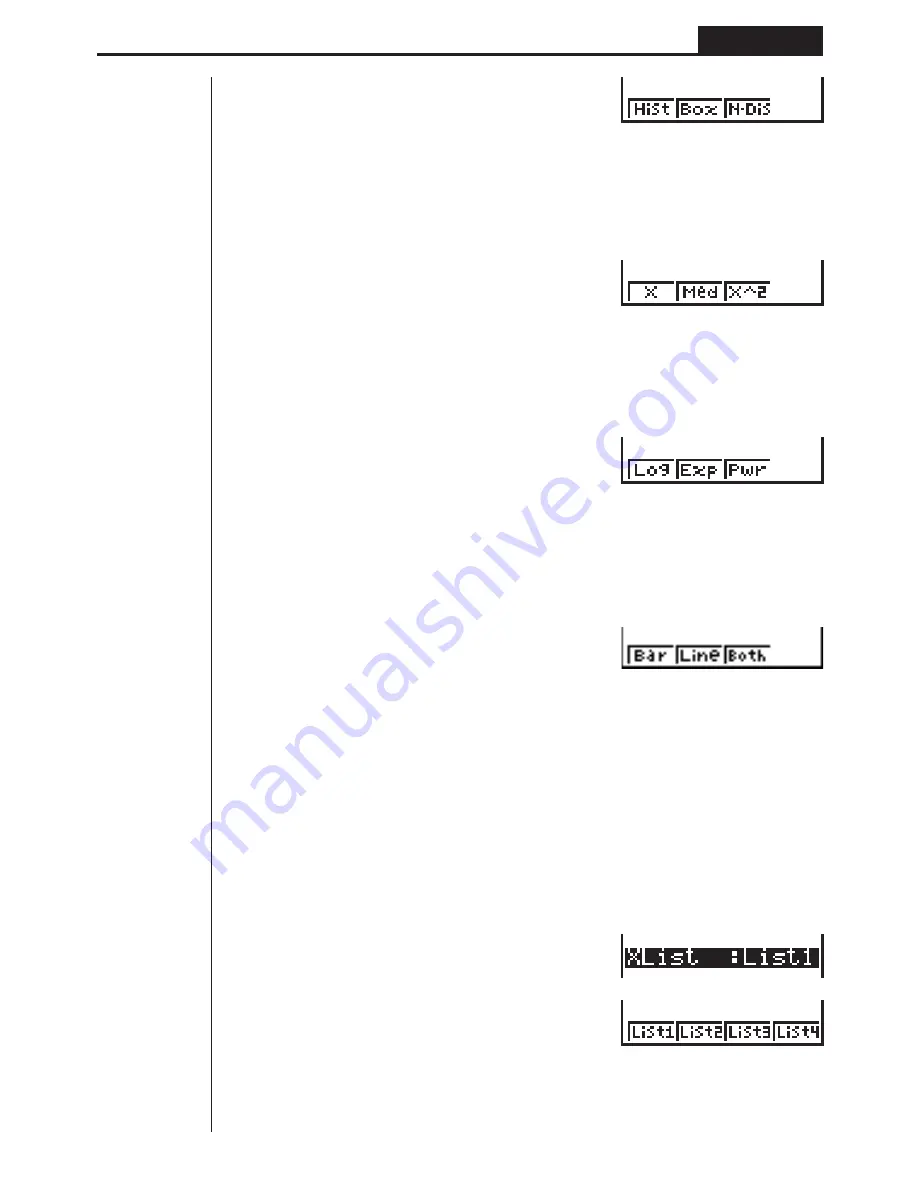
1
(Hist) ......... Histogram
2
(Box) ......... Med-box graph
3
(N•Dis) ...... Normal distribution curve
[
1
(X) ............ Linear regression graph
2
(Med) ........ Med-Med graph
3
(X^2) ......... Quadratic regression graph
[
1
(Log) ......... Logarithmic regression graph
2
(Exp) ......... Exponential regression graph
3
(Pwr) ......... Power regression graph
[
1
(Bar) ......... Bar graph
2
(Line) ........ Line graph
3
(Both) ....... Bar graph and line graph
Press
[
to return to the previous menu.
u
u
u
u
u
To select the
x
-axis data list (XList)
1. While the graph settings screen is on the display, use
f
and
c
to move the
highlighting to the XList item.
Содержание fx-7400G PLUS
Страница 7: ... fx 7400G PLUS ...
Страница 14: ...xii Contents ...
Страница 57: ...Differential Calculations Chapter 3 ...
Страница 176: ...162 Chapter 8 Programming ...
Страница 188: ...Chapter 9 Data Communications 174 ...
Страница 199: ...185 1 2 3 4 5 Program for Circle and Tangents No 4 Step Key Operation Display ...
Страница 200: ...186 Program for Circle and Tangents No 4 Step Key Operation Display 6 7 8 9 10 ...
Страница 201: ...187 11 12 13 14 15 Program for Circle and Tangents No 4 Step Key Operation Display ...
Страница 202: ...188 16 17 18 Program for Circle and Tangents No 4 Step Key Operation Display ...
Страница 205: ...191 1 2 3 4 5 Program for Rotating a Figure No 5 Step Key Operation Display ...


