


137
Storing, Logging and Printing
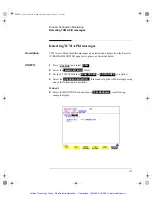
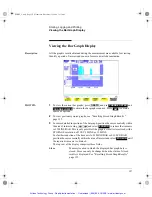
Viewing the Bar Graph Display
Viewing the Bar Graph Display
Description
All the graphic results obtained during the measurement are available for viewing.
Identify a period of interest and zoom in for more detailed examination.
HOW TO:
1
To view the current bar graphs, press
and use
and
to obtain the bar graphs required. Press
to obtain a
choice of options.
2
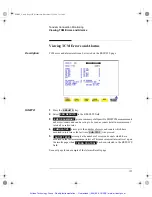
To view previously stored graphs, see "Recalling Stored Graph Results "
page 135.
3
For more detailed inspection of the bar graph, position the cursor centrally within
the area of interest using
,
and select
to reduce the time axis
to 15 MINS/BAR. This is only possible if the graphics results were stored with a
STORAGE resolution of 1 SEC,1 MINS or 15 MINS.
For further reduction of the time axis to 01 MINS/BAR or 01 SECS/BAR,
position the cursor centrally within the area of interest and select
until
the required time axis is obtained.
The top row of the display comprises three fields:
Store
Memory location in which the displayed bar graph data is
stored. Store can only be changed when the status of stored
results is displayed. See "Recalling Stored Graph Results "
page 135.
GRAPH
CHANGE UPPER
CHANGE LOWER
SET
ZOOM IN
ZOOM IN
SONET_Usr.bk Page 137 Wednesday, December 13, 2000 11:11 AM
Artisan Technology Group - Quality Instrumentation ... Guaranteed | (888) 88-SOURCE | www.artisantg.com


