27
3.4. Configuration of the visualisation
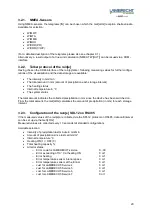
The visualisation will be configured directly on the page „files“, on which the current values are dis-
played.
The measurement values to be displayed can be summarised in groups.
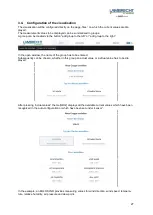
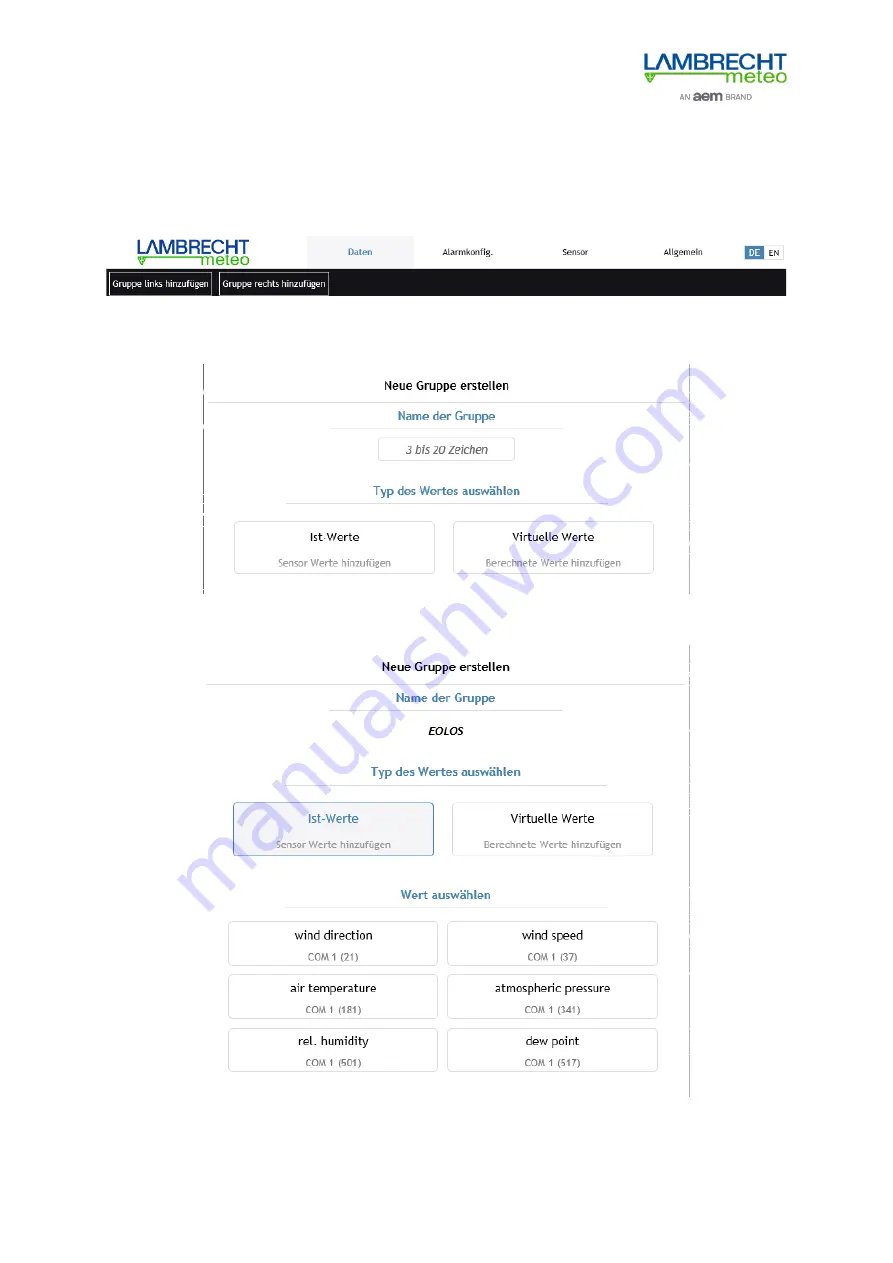
A group can be created via the button “add group to the left” or “add group to the right”.
In the open window, the name of the group has to be entered.
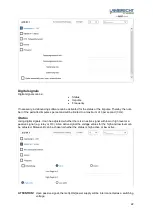
Subsequently can be chosen, whether in this group an actual value or a virtual value has to be dis-
played.
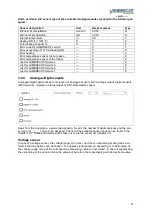
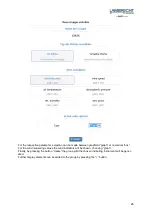
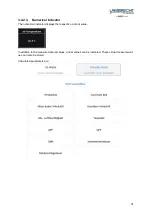
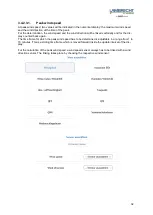
After pressing “actual values“ the met[LOG] displays all the available current values which have been
recognised in the auto-configuration or which have been set under “sensor”.
In the example, an EOLOS-IND provides measuring values for wind direction, wind speed, tempera-
ture, relative humidity, air pressure and dew point.
Содержание LAMBECHT METEO 00.95800.010000
Страница 9: ...9 Wiring diagram EOLOS...
Страница 10: ...10 Wiring diagram ARCO Modbus...
Страница 11: ...11 Wiring diagram rain e Modbus...
Страница 13: ...13 Connection example with power cube met LOG EOLOS Modbus rain e Modbus...
Страница 14: ...14 Connection example with power cube met LOG u sonic...


