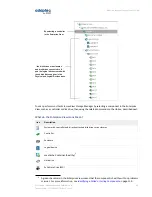
Description
Icon
Connector or other physical device
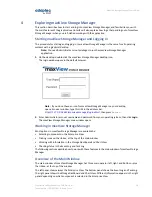
The Ribbon
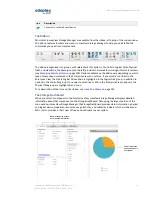
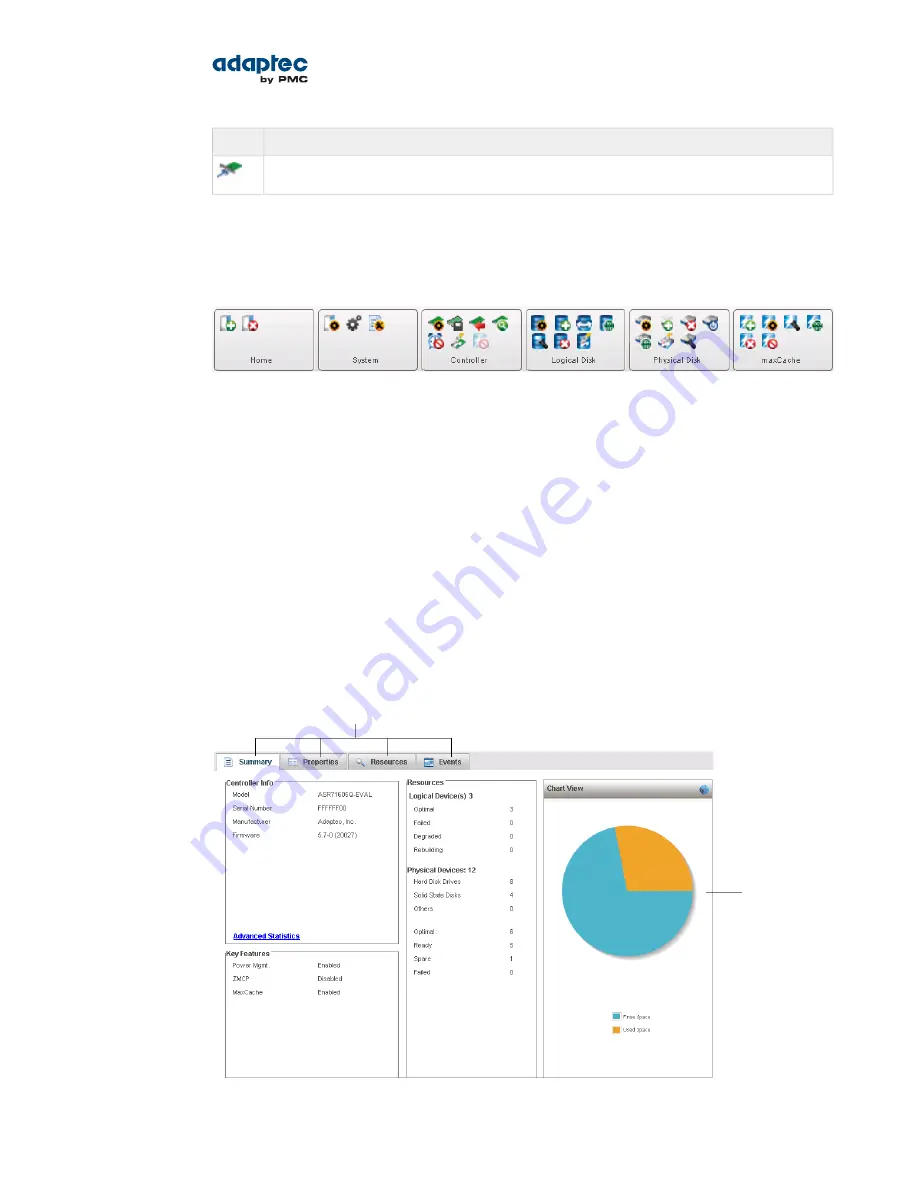
Most tasks in maxView Storage Manager are available from the ribbon, at the top of the main window.
The ribbon replaces toolbars and menus in maxView Storage Manager to help you quickly find the
commands you need to complete a task.
The ribbon is organized into groups, with related tasks for Systems, Controllers, Logical Disks, Physical
Disks, and maxCache; the Home group (on the left) provides commands for working with remote systems
(see
Managing Remote Systems
on page 105). Options available on the ribbon vary, depending on which
type of component is selected in the Enterprise View. For instance, if you select a controller in the
Enterprise View, the Create Logical Drive option is highlighted in the Logical Disk group, in addition to
options in the Controller group. If you select a disk drive or SSD in the Enterprise View, options in the
Physical Disk group are highlighted; and so on.
For a description of the icons on the ribbon, see
Icons At-a-Glance
on page 123.
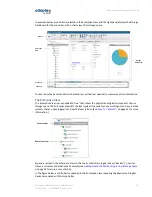
The Storage Dashboard
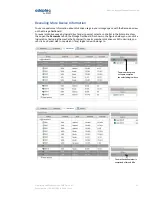
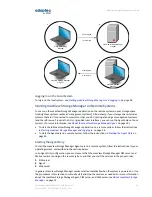
When you select a component in the Enterprise View, maxView Storage Manager displays detailed
information about that component on the Storage Dashboard. Occupying the largest portion of the
main window in maxView Storage Manager, the Storage Dashboard provides status information, physical
and logical device properties, resources, usage statistics, and reliability indicators for hard drives and
SSDs. It also provides a chart view of free and used space in your system.
Tabs provide quick access
to component information
Chart view of free
and used space in
your system
31
Proprietary and Confidential to PMC-Sierra, Inc.
Document No.: CDP-00278-02-A Rev. A, Issue:
maxView Storage Manager User's Guide


