34
M ICROG UA R D™ SOLUTION |
M I C R O G UA R D | U M/M I C R O G UA R D - EN R E V. B
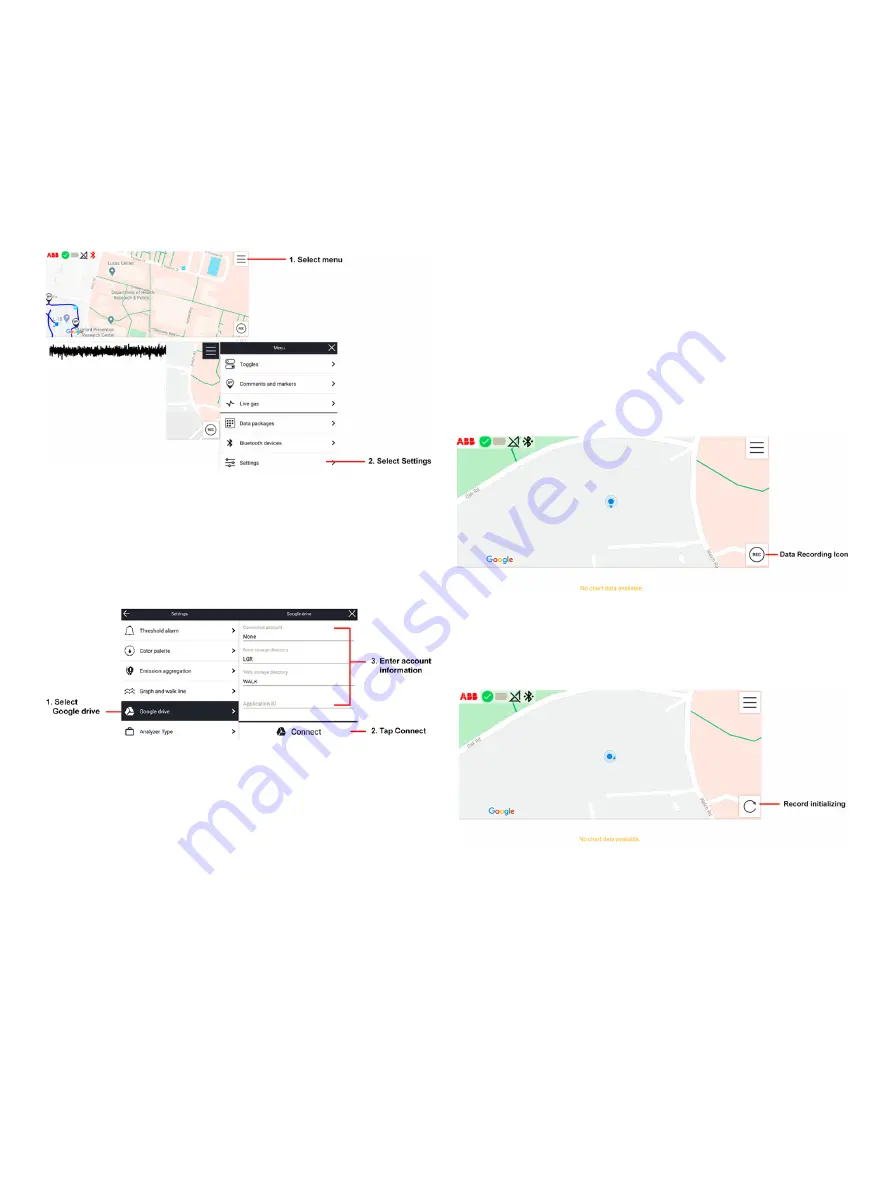
Google Drive Account Log-in
If you will use Google Drive to store data, log into your Google
Drive account as follows:
1
Select the
Menu
icon in the upper right corner, then select
Settings
(see Figure 84) .
. . .6 Using the System
Figure 85 Accessing Settings Menu
Figure 87 Data Recording Icon
Figure 88 Data Recording Initializing
Figure 86 Log into Google Drive Account
2
Select
Google drive
(see Figure 85) .
3
Tap
Connect
.
4
Enter your Google Drive account information .
Standard Operation
MicroGuard™ streams data from the analyzer in real time and
through a variety of features, has the ability to assist users in
locating gas emissions . This data displays in the map and the
graph below it . If any of the described features in the manual do
not function as described, refer to the troubleshooting portion
of the manual and contact Service .
Recording Icon
Tap the data recording icon (
REC
) to gather and record data
from the analyzer: The data will be displayed in real time as a
ppm graph in the ABB chart portion in the lower part of the
screen .
Figure 86 shows the
REC
icon before being activated .
Once the
REC
icon is tapped, it changes to a circular arrow,
indicating initialization (see Figure 87) .
When data are available, the
REC
icon turns red indicating data
are being recorded . The data are displayed in a time-dependent
graph on the bottom of the screen . (See Figure 88)