35
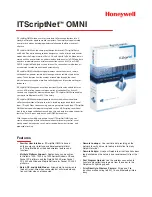
Figure 21: TM-2420/TM-2421 Recorder Setup dialog box
Step 3
Select the Recorder ID field. Input a Recorder ID number between 1 to 99.
Step 4
Select the Display check box to set the display to On or Off.
Step 5
Select the Buzzer check box to set the buzzer On or Off.
Step 6
Select the Time field for Period One (1) and enter the time you want the monitoring
session to begin. Use military time to set the Time.
Note
: The Time for Period One (1) also defines the End of the monitoring session 24
hours later. See examples at the end of this section.
Step 7
Select the Interval drop-down menu for Period One (1) and set the measurement
Interval for Period One (1) to: OFF, 1
, 3
5
, 5, 10, 15, 20
5
, 30, 60 or 120
5
minutes.
Step 8
If you want to program a second period, go to step 9.
If you do not want to program a second period, go to step 17.
Step 9
Select the Time field for Period Two (2) and enter the time you want for this period;
this will also set the end for period One (1). Use military time to set the Time. See
examples at the end of this section.
Step 10
Select the Interval drop-down menu for Period Two (2) and set the measurement
Interval for Period Two (2) to: OFF, 1, 3, 5, 10, 15, 20
,
30, 60 or 120 minutes.
Step 11
If you want to program a third period, go to step 12.
If you do not want to program a third period, go to step 17.
Step 12
Select the Time field for Period Three (3) and enter the time you want for this period;
this will also set the end for period Two (2). Use military time to set the Time. See
examples at the end of this section.
5
The 1 and 3-minute measurement intervals are available only with the TM-2420/TM- 2421.
The 20-minute measurement interval is available only with the TM-2421.
The 120-minute measurement interval is available only with the TM-2421/ TM-2430.
Содержание Doctor Pro TM-2430-13
Страница 54: ...53 4 PRINTOUT EXAMPLES Figure 36 Patient information Text data ...
Страница 55: ...54 Figure 37 Summary data Full and partial Text data ...
Страница 56: ...55 Figure 38 Summary data Awake and sleep Text data ...
Страница 57: ...56 Figure 39 Blood pressure data Text data ...
Страница 58: ...57 Figure 40 Trend graph Blood pressure and double product Graphical data ...
Страница 59: ...58 Figure 41 Correlation plots upper and histogram plots lower Graphical data ...
Страница 60: ...59 Figure 42 Circadian rhythm plots upper and HBI analysis plots lower Graphical data ...
Страница 61: ...60 Figure 43 Mini report 1 ...
Страница 62: ...61 Figure 44 Mini report 2 ...
Страница 67: ...66 MEMO ...
Страница 68: ...67 MEMO ...
Страница 69: ...68 MEMO ...