background image

30

2-6-8 Patient Information

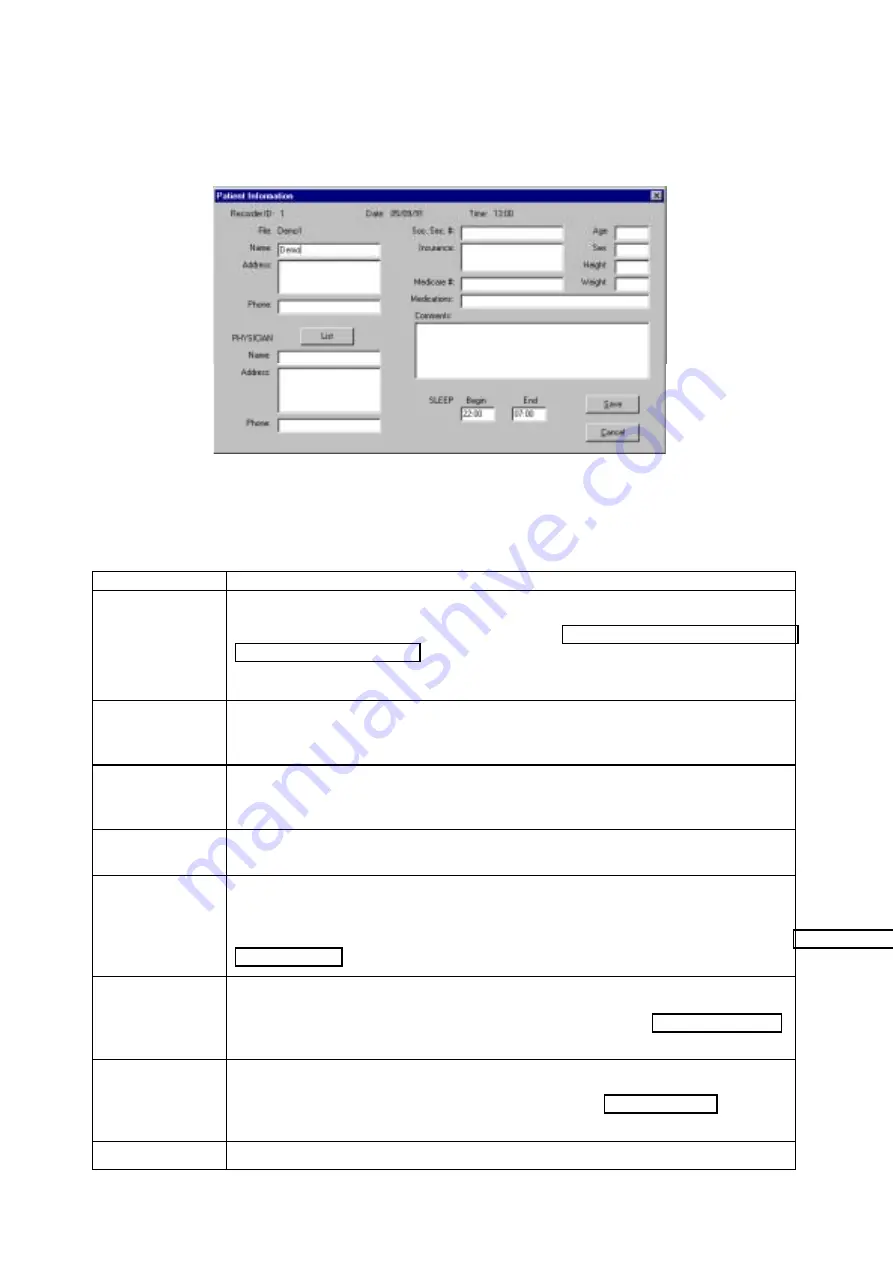
The Patient Information screen is used to store information on patients and their treatment. This is

also the input screen for the patient’s Sleep interval.

Figure 18: Patient Information display

The Patient Information screen has the following data fields:

(The characters referred to in the table below include CRs and spaces.)

Field

Description

Recorder ID

Recorder ID refers to the monitor identification number. The Recorder ID
cannot be modified in this screen. It is established during the recorder setup
prior to the monitoring session. See “

2-7-3 Programming the Monitor’s

Intervals and Conditions

”.

For the TM-2420, the ID number is fixed to “1”.

Date

Date corresponds to the first measurement date in the patient record. Date
cannot be modified in this screen. It is automatically set at the time the
measurement was recorded.

Time

Time corresponds to the first measurement time in the patient record. Time
cannot be modified in this screen. It is automatically set at the time the
measurement was recorded.

File

File refers to the name of the file. It is initially defined by the user at the time of
data retrieval. See “

2-7-1 Retrieving Data from the Monitor

”.

Name

There are two name fields. Enter up to 20 characters for the patient name
when the data is retrieved. Selecting this field allows changes to the patient
name. Enter up to 60 characters for the physician name. The physician’s name
may be entered automatically by selecting the List button. See “

2-9-2

Physician List

”.

Address

There are two address fields. The patient address field may be filled in
manually. The physician address field may either be filled in manually, or
automatically by selecting the List button. See “

2-9-2  Physician List

”.

Up to 50 characters can be used for each address field.

Phone

There are two telephone fields. The patient phone field may be filled in
manually. The physician phone field may either be filled in manually, or
automatically by selecting the List button. See “

2-9-2  Physician List

”.

Up to 20 characters can be used for each phone field.

Soc. Sec. #

Field for the patient’s social security number. Up to 20 characters can be used.

Содержание Doctor Pro TM-2430-13

Страница 1: ...TM 2430 13 Doctor Pro Ambulatory Blood Pressure Monitor Data Analysis Software INSTRUCTION MANUAL WM PD4000019C ...

Страница 2: ... 2 Connecting the TM 2430 series to the computer 7 2 2 3 Connecting the UA 767PC to the computer 8 2 3 Main Screen Description 9 2 4 Toolbar 10 2 4 1 Analysis Intervals 10 2 4 2 BP Mode 11 2 5 File Menu 12 2 5 1 Open 13 2 5 2 Save As 13 2 5 3 Delete 13 2 5 4 Convert 14 2 5 5 File Merge 14 2 5 6 Print 15 2 5 7 Exit 15 2 5 8 Saving a File 15 2 5 9 Closing a Data File 15 2 6 View Menu 16 2 6 1 Summar...

Страница 3: ... 2 8 6 Closing the Report dialog box 43 2 9 Options Menu 44 2 9 1 Report formats 44 2 9 2 Physician List 44 2 9 3 Trend Display 45 2 9 4 Default Settings 46 2 10 On line Help 47 3 TROUBLESHOOTING 48 3 1 Measurement Errors 48 3 1 1 TM 2420 TM 2421 Error Codes 48 3 1 2 TM 2430 Series Error Codes 50 3 2 Communication Errors 51 3 3 Missing Files 52 3 4 Reports Are Not Printing With the Desired BP Mode...

Страница 4: ...in full partial sleep and awake intervals respectively in full screen by switching between clearly labeled tabs Graphical Data Systolic diastolic blood pressure mean arterial blood pressure and pulse data are displayed graphically to quickly determine patterns or trends in the data Circadian rhythm and HBI analysis are displayed graphically and numerically Data Conversion The Data Convert feature ...

Страница 5: ...iod the monitor may be programmed to record the patient s blood pressure at 11 31 5 10 15 201 30 60 and 1201 minute intervals The monitor can also be programmed to remain OFF during any time interval These measurement intervals may be timed to coincide with the patient s daily activities The A D TM 2020 TM 2021 Printer Processor Interface is used for performing one or more of the following functio...

Страница 6: ... At least 2 5 MB Serial Ports Minimum one 9 pin D SUB or 25 pin D SUB A cable separately available is required for the 25 pin D SUB serial port Printer Type Printers supported by MS Windows operating system 1 6 Installing the Software The software must be run from a hard disk drive only It may not be run from a floppy disk To install the software on your hard disk drive complete the following inst...

Страница 7: ...ion between the monitor and the computer must be established first 2 2 1 Connecting the TM 2420 TM 2421 to the computer You must use the A D supplied RS 232C communication cable otherwise communication errors will occur Steps 1 4 must be completed prior to accessing the software or it may not recognize that the monitor is connected to the computer If proper communication is not established a cable...

Страница 8: ... functions Step 5 Press the ENTER key on the processor keypad A series of 6 dashes will appear on the processor screen Step 6 Run the software Step 7 Confirm that the correct serial port is set For details see 2 9 4 2 Serial Port 2 2 2 Connecting the TM 2430 series to the computer You must use the A D supplied RS 232C communication cable otherwise communication errors will occur You must use AX KO...

Страница 9: ...d the computer The illustration above is not to scale Step 1 Connect the male end of the A D supplied RS 232C communication cable to the monitor Step 2 Connect the female end of the A D supplied RS 232C communication cable to the computer Step 3 After the connection the display on the monitor will not change The display will show just before starting communication Note If possible keep the cable c...

Страница 10: ...s the basis for statistical and graphical analysis Note This only applies to TM 2421 data files Main Menus Menu See Description File 2 5 File Menu The File menu may be used to manage the files stored on the hard drive or a floppy disk and to exit the software View 2 6 View Menu The View menu may be used to access the statistical tabular and graphical analysis screens Recorder 2 7 Recorder Menu The...

Страница 11: ... interval box using the scroll bar Step 3 Check a Status button in the Partial analysis interval box When Enabled is checked set each item in the box Step 4 Click the Save button Step 5 To cancel the settings click the Cancel button The Partial Analysis Interval affects many of the software features including Summary Data After the Partial Analysis Interval is enabled the Partial tab in the Summar...

Страница 12: ...d Setting Description Oscillometric only This option sets the primary blood pressure choice to oscillometric and disables the secondary choice If the oscillometric reading for any measurement is invalid or has been excluded by the user in the BP Data List the measurement will be excluded from graphical displays and statistical computations 1 Oscillometric 2 Korotkoff This option sets the primary b...

Страница 13: ...sed to select a data file for viewing modifying or printing a report After a file has been opened the file name patient name and date of the monitoring session are displayed in the title bar of the main screen Save As This function is used to copy a selected file to a new file with a different name Delete This function is used to delete a selected file Convert This function is used to convert the ...

Страница 14: ...ve As The File Save As function is used to copy an open data file to another data file with a different name or to a different directory with any name When a file is copied corresponding dat and p files are created These two files must stay together within the same directory The Save As function creates new dat and p file with the new file name in the selected directory When entering a new file na...

Страница 15: ...a new file Figure 7 File Merge dialog box To merge multiple data files complete the following steps Step 1 Select the File menu Step 2 Select the Merge the BP data files sub menu Step 3 Select the data type to be merged Step 4 Open the folder that contains the data files to be merged Step 5 Drag the selected data files to the Merge File List Box Step 6 Click the OK button Step 7 Save the selected ...

Страница 16: ...t Selection dialog box select the report format that you want to use for the reports or click Print Mini report to print a condensed report For Mini report printout examples see pages 60 and 61 2 5 7 Exit The File Exit selection may be used to exit the software 2 5 8 Saving a File Files are automatically saved when the data is retrieved from the monitor See 2 7 1 Retrieving Data from the Monitor A...

Страница 17: ... fluctuation and the density of a 24 hour blood pressure data Histograms 2 6 5 Histograms Function for viewing the frequency distribution of the measurement data Allows easy observation of the data that occurs most frequently the frequency distribution and the distribution width during the time interval Circadian rhythm 2 6 6 Circadian Rhythm Function for viewing the graph showing the estimated am...

Страница 18: ...e or print the individual Summary Data screen complete the following steps Step 1 Select the View menu Step 2 Select the Summary Data sub menu The Summary Data display appears Figure 8 Summary Data display Step 3 Click one of the four data tabs Full Partial Awake or Sleep The Full tab will always be enabled The Partial Sleep and Awake tabs will be enabled after they are specified See 2 4 1 Analysi...

Страница 19: ...of the value for Systolic Diastolic MAP and Pulse measurements during the Time Interval SE Standard Error The Standard Error of the value for Systolic Diastolic MAP and Pulse measurements during the Time Interval CV Coefficient of Variation The Coefficient of Variation for Systolic Diastolic MAP and Pulse measurements during the Time Interval SYS DIA limits Systolic and Diastolic limits for the Aw...

Страница 20: ... Position 1 BP method O or K Denotes the BP method used for the specific measurement K refers to Korotkoff method O refers to oscillometric method Position 2 E Event Indicates that data was measured when the monitor s EVENT button was activated Position 3 Error code Denotes the specific error code that occurred during the monitoring session see 3 1 Measurement Errors Exclude When this column has a...

Страница 21: ...software automatically excludes measurements if an error occurred during the reading Measurements that have been automatically excluded are displayed with and X in the Exclude column and cannot be included by the user Note Measurements that have been excluded are not deleted from the data file 2 6 2 2 Entering Comments Comments such as information taken from the patient activity diary may be enter...

Страница 22: ... Mode Measurement Method Sleep Interval Blood Pressure Limits The following four trends can be displayed in the Trend function Systolic Diastolic Blood Pressure BP Trend The vertical axis represents millimeters of mercury mmHg and the horizontal axis represents time A vertical dotted line connects the measurement s systolic and diastolic pressures This line may be used to estimate the pulse pressu...

Страница 23: ...he specified limits These lines may be used to determine when the patient exceeds the user defined limits during the monitoring session Scroll bar Linking The scroll bar at the bottom of the Trends Screen allows you to scroll through the Trend Graphs You may also link the Trends Screen to the Blood Pressure Data List by aligning the left hand side of a Trends Screen with the vertical line of an in...

Страница 24: ...he screen To scale the Trends Screen complete the following steps Step 1 Select the Zoom drop down menu on the Trends toolbar Step 2 Select a scale to view the screen All data 1 3 6 or 12 hours 2 6 3 3 Trend Display Positioning Trends The Trends Screen may be customized to show one or more trends on the screen simultaneously in any order The trends positions may be set to Blood Pressure Systolic D...

Страница 25: ... instructions for these features have been combined Figure 12 Trend Page Setup dialog box Step 1 Select the Select menu on the top left hand corner of the Trends toolbar Step 2 To create a new Trend template select New and go to step 3 To edit a Trend Page go to step 4 Step 3 Input a name for the New Trend Page and go to step 6 Step 4 Highlight the Trend Page template you want to edit and click th...

Страница 26: ...n Line The vertical axis represents systolic pressure the horizontal axis represents the diastolic pressure on the left hand graph and pulse on the right hand graph All the graphs have scales of 0 to 300 mmHg Note If Partial Analysis is enabled four graphs will appear The first two graphs on the left hand side of the screen in blue are based on Full data The second pair of graphs in red on the rig...

Страница 27: ...26 measurements Measurement statistics Mean m Standard Deviation s and Correlation Coefficient r values are shown on the bottom of the screen Figure 14 Correlation Plots display ...

Страница 28: ...Analysis overlaid in red Double Product Full Analysis in blue Partial Analysis overlaid in red Pulse Full Analysis in blue Partial Analysis overlaid in red Statistical Data4 MEAN m and SD s for SYS DIA MAP DP and PULSE Full Analysis is in blue Partial Analysis in red The vertical scale represents 0 to 300 mmHg or BPM on all graphs except Double Product The horizontal scale represents the percentag...

Страница 29: ...alysis The analysis starting time coincides with the start time specified for the Full Analysis interval The Circadian Rhythm screen also shows the amplitude and peak value of the cosine wave based on the 95 confidence interval The systolic blood pressure data is indicated in red the diastolic blood pressure data in blue and the pulse data in yellow Figure 16 Circadian Rhythm display ...

Страница 30: ...into a one day period The lower graph shows the hypobalic area in red not reaching the user defined hypobalic limits for the systolic and diastolic blood pressures and the numerical data converted into a one day period For both graphs the analysis starting time coincides with the start time specified for the Full Analysis interval Note For details on the hyperbalic and hypobalic limits see 2 9 4 1...

Страница 31: ...It is automatically set at the time the measurement was recorded File File refers to the name of the file It is initially defined by the user at the time of data retrieval See 2 7 1 Retrieving Data from the Monitor Name There are two name fields Enter up to 20 characters for the patient name when the data is retrieved Selecting this field allows changes to the patient name Enter up to 60 character...

Страница 32: ...e 11 p m equals 23 00 Midnight equals 00 00 and 9 a m equals 09 00 Use a colon between hours and minutes Follow the instructions below to view edit and print the Patient Information screen Step 1 Select the View menu Step 2 Select the Patient Information sub menu Step 3 To edit a field select the appropriate field and input the information Step 4 To save the edits and close the Patient Information...

Страница 33: ...ng process e g connected or retrieving data With the monitor and the processor connected to the computer you may retrieve data from the monitor by completing the steps below Step 1 Select the Recorder menu Step 2 Select the Retrieve data sub menu Step 3 Select the Patient name field and input the patient s name The name will appear in the Name field on the Patient Information screen Note You must ...

Страница 34: ...nd the processor connected to the computer you may clear the measurement data stored in the monitor by completing the steps below Step 1 Select the Recorder menu Step 2 Select the Clear Data sub menu Figure 20 Recorder Clear Data dialog box Step 3 To clear the monitor s memory click the OK button Step 4 To not clear the monitor s memory click the Cancel button CAUTION Cleared data cannot be recove...

Страница 35: ...ion Note When only the Time of the first 1 period is set the monitoring session is performed at the same interval for 24 hours The Time of the second 2 period if set is the start of the second period and end of the first The Time of the third 3 period if set is the start of the third period and end of the second The Time of the fourth 4 period if set is the start of the fourth period and end of th...

Страница 36: ...nt to program a second period go to step 17 Step 9 Select the Time field for Period Two 2 and enter the time you want for this period this will also set the end for period One 1 Use military time to set the Time See examples at the end of this section Step 10 Select the Interval drop down menu for Period Two 2 and set the measurement Interval for Period Two 2 to OFF 1 3 5 10 15 20 30 60 or 120 min...

Страница 37: ...cancel the programming and close the Recorder Setup dialog box click the Cancel button 2 7 3 2 TM 2430 Series Setup The recorder setup for the TM 2430 series is similar to the TM 2420 TM 2421 except that it includes two additional options for setting the BP measurement intervals as shown in Figure 22 Figure 22 TM 2430 series Recorder Setup dialog box Description of each mode is as follows Mode 1 0...

Страница 38: ...r to measure the patient s blood pressure every 30 minutes Remember that the Time for Period One 1 also defines the End of the monitoring session The end time for Period 1 will default to the Time for Period One 1 in this case 09 00 PERIOD TIME INTERVAL DURATION 1 09 00 09 00 30 minutes 24 hours Total 24 hours The following is the recorder setup according to these instructions Note Set Period One ...

Страница 39: ...ime for Period One 1 also defines the End of the monitoring session The end time for Period Three 3 will default to the Time for Period One 1 in this case 09 00 PERIOD TIME INTERVAL DURATION 1 09 00 22 00 30 minutes 13 hours 2 22 00 07 00 1 hour 9 hours 3 07 00 09 00 15 minutes 2 hours Total 24 hours The following is the recorder setup according to these instructions Note Set Periods One 1 Two 2 a...

Страница 40: ...sure measured every 15 minutes Remember that the Time for Period One 1 also defines the End of the monitoring session The end time for Period Four 4 will default to the Time for Period One 1 in this case 09 00 PERIOD TIME INTERVAL DURATION 1 09 00 22 00 30 minutes 13 hours 2 22 00 23 00 OFF 1 hours 3 23 00 06 00 1 hour 7 hours 4 06 00 09 00 15 minutes 3 hours Total 24 hours The following is the re...

Страница 41: ...time can not be entered in different boxes Enter different times for each box Step 4 Click the OK button to confirm the settings If the settings are not correct reset them or go to Step 5 Step 5 To cancel the settings and close the dialog box click the Cancel button 2 7 4 Blood Pressure Measurement Available only with the UA 767PC When the UA 767PC connected to a personal computer blood pressure m...

Страница 42: ...xisting report template Delete an existing report template Save an existing template as the default report style Print a user defined report Print a Mini report Close the Report dialog box Figure 27 Report dialog box To open the Report dialog box print a report create a new report template or edit an existing template select the Report menu on the main menu Note Not available with the UA 767PC ...

Страница 43: ... report by checking the appropriate boxes Note You may check all or none of these boxes An unchecked box will not print a checked box will print Step 5 Select the Graphical Data you want included in the report by checking the appropriate boxes Note You can check all or none of these boxes An unchecked box will not print a checked box will print Step 6 Select the Measurement Method to base the repo...

Страница 44: ...priate radio button Step 8 Save the report template by clicking the Save button Step 9 If you do not want to save the report template click the Cancel button 2 8 3 Deleting an Existing Report Template Step 1 Highlight the report template you want to delete in the Report dialog box Step 2 Click the Delete button The highlighted report template will be deleted Step 3 To cancel this operation click t...

Страница 45: ...kly updated Trend Display 2 6 3 3 Trend Display Positioning Trends The Trend Display may be used to customize the Trends Screen Default Settings 2 9 4 Default Settings There are three default settings 1 BP settings Blood Pressure settings which may be used to set the default BP mode and BP limits 2 Serial port which may be used to set the communication port for interfacing with the monitor 3 Monit...

Страница 46: ...sician in the List Step 1 Highlight the physician s name you want to edit Step 2 Click the Edit button The Physician Entry dialog box will appear Step 3 Select the field to edit and then type the new data Note All fields must be completed Step 4 Save the edited physician template by clicking the Save button If you do not want to save the edited physician click the Cancel button 2 9 2 3 Deleting an...

Страница 47: ... readings exceeding the specified Systolic and Diastolic limits for the Awake and Sleep interval will be calculated and noted both in the Summary Data and printed reports The values are used as limits for HBI analysis Hypobalic limit The percentage of readings not reaching the specified Systolic and Diastolic limits for the Awake and Sleep interval will be calculated and noted both in the Summary ...

Страница 48: ...er Type function is used to select the type of monitor the software will communicate with for all Recorder functions This function does not affect which type of data files the software can analyze 2 10 On line Help Help screens are available for on line software assistance There are three ways to access the Help function 1 Select the Help menu on the Menu bar 2 Click Help buttons which appear on v...

Страница 49: ...itor is charged Plug the AC adapter in the monitor The c shown on the display will disappear after 30 minutes Wait the full 60 minutes charging time to ensure that the battery is fully charged Note The monitor will hold all stored readings in memory for two weeks after the appearance of the low battery indicator E05 Measurement time exceeds 100 seconds Inflation time error Check E01 and E02 proced...

Страница 50: ...rtain physiological conditions or pharmaceutical treatment may excessively reduce or increase a pulse rate In cases of excessively low pulse rates have the subject walk or stand a few minutes to raise the pulse rate above 35 beats per minute E21 Diastolic greater than 160 mmHg or less than 40 mmHg Outside of normal physiological parameters E22 Systolic greater than 280 mmHg or less than 60 mmHg Ou...

Страница 51: ... than 160 mmHg or less than 40 mmHg Measure the blood pressure by other methods E22 Systolic greater than 280 mmHg or less than 60 mmHg Measure the blood pressure by other methods E23 DSD greater than 150 mmHg or less than 10 mmHg DSD difference between systolic blood pressure and diastolic blood pressure Measure the blood pressure by other methods E30 E31 Air leaks in the cuff assembly Repair is ...

Страница 52: ... is correct Step 5 Disconnect the monitor from the processor and reconnect them TM 2420 TM 2421 Disconnect the cable and reconnect it TM 2430 UA 767PC Step 6 Attempt communication You may need to go through the process a few times to re establish communication If the error still persists complete the steps below Step 1 Exit the software Step 2 Disconnect the monitor from the processor and reconnec...

Страница 53: ... BP Mode is separate from the Report Format BP Mode settings The BP Mode defined in the toolbar is not necessarily the BP Mode that will be used for the printed report For information on how to set the BP Mode for the printed report see 2 8 2 Editing an Existing Report Template Figure 35 Report Setup dialog box 3 5 Summary Data Sleep Tab Data can not be Seen Make sure that the Sleep parameters in ...

Страница 54: ...53 4 PRINTOUT EXAMPLES Figure 36 Patient information Text data ...

Страница 55: ...54 Figure 37 Summary data Full and partial Text data ...

Страница 56: ...55 Figure 38 Summary data Awake and sleep Text data ...

Страница 57: ...56 Figure 39 Blood pressure data Text data ...

Страница 58: ...57 Figure 40 Trend graph Blood pressure and double product Graphical data ...

Страница 59: ...58 Figure 41 Correlation plots upper and histogram plots lower Graphical data ...

Страница 60: ...59 Figure 42 Circadian rhythm plots upper and HBI analysis plots lower Graphical data ...

Страница 61: ...60 Figure 43 Mini report 1 ...

Страница 62: ...61 Figure 44 Mini report 2 ...

Страница 63: ...mption by the heart muscles obtained by the equation below DP SYS PUL 100 5 2 Terms Related to Statistics Term Abbreviation Description MEAN AV m Arithmetic mean value of the sampled data MAX Maximum value in the sampled data MIN Minimum value in the sampled data Hourly Average Arithmetic mean value of the data sampled in one hour SD S Standard Deviation Obtained by the equation below About the sa...

Страница 64: ...rm Abbreviation Description Cosinor Cosine Vector Circadian rhythm analysis method introduced by Halberg et al 1967 In Cosinor twenty four hours are plotted on Acrophase and Amplitude of Acrophase are indicated on an r axis 95 confidence interval is used If the interval does not include the origin the data is interpreted that a statistically meaningful rhythm exists If the interval includes the or...

Страница 65: ...e cosinor analysis is considered as valid Variation Index Variation index of rhythm Numerical value obtained as described below Difference between the maximum value and minimum value of the cosine curve best fitted to the biological rhythm data divided by the maximum value When the maximum value is the blood pressure obtained by day and the minimum value is the blood pressure obtained at night the...

Страница 66: ...value of a healthy person according to age and sex Hypobalic Area Time integral of the blood pressure values not reaching the limits 24 hour blood pressure data is plotted on a trend bar graph and an integral is performed on the area not reaching the user defined limits Expressed as an index per day Usually the risk is managed by comparing the data with the HBI value of a healthy person according ...

Страница 67: ...66 MEMO ...

Страница 68: ...67 MEMO ...

Страница 69: ...68 MEMO ...

Отзывы: