SonTek, a Xylem brand
RiverSurveyor S5/M9 System Manual (February 2013)
85
•
Visually review each measurement by clicking on each tab or by using
Ctrl+Tab
•
Evaluate BottomTrack vs. GPS (if applicable) to observe any compass,
GPS or moving bed issues.
•
Make sure the magnetic declination is set appropriately for the site (the
default setting is zero).
•
Make sure that the GC-BC (angle of average GPS course since start of
transect minus ADP bottom-track course; value near 0 is desired) is less
than 2 degrees and the D(BT)/D(GPS) (Ratio of Bottom Track track dis-
tance to GPS track distance) is approximately 1 (Sidebar data).
•
Be sure the number of GPS satellites is good and the GPS quality is valid
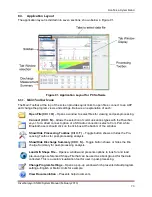
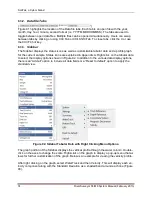
2. On the Transect tab, evaluate different plots by right-clicking on the vertical axes.
o
Plot the depth measured by the Vertical Beam as well as Bottom Track depth.
Make sure the VB and BT depth scales are the same. Check for any major dis-
crepancies.
o
Evaluate Boat Speed and Water speed plotted on the same graph. Ideally, the
Boat speed should not exceed the water speed where possible.
o
Make sure that Heading/Pitch/Roll and Temperature are relatively constant.
o
Verify that the SNR data and beams are valid with special focus on the edges
and shallow water.
o
Verify water velocity in ENU: U (up) and D (Delta) should be close to zero.
o
Make sure that discharge curve and profile extrapolation is applicable (using
Processing Toolbox – Profile Extrapolation).
o
Verify that the SNRs are valid for the contour (graph at the bottom).
o
Verify that the velocity cell cutoff on the contour plot is valid, also look at the
screening distance and make sure that is graphically correct.
3. In the Discharge Measurement Summary make sure that:
o
References and Coordinates should be the same
o
Starting edges should alternate
o
Date/times should be consecutive
o
Duration of measurements should be similar
o
Use the Statistics to identify any outliers


