Viewing Events
101 Wavion
Table- 7.2
Full Event Log page
Field
Description
Total Events
Number of total events in log
Events per page
Number of events shown per page; modifiable
Page navigator
Allows paging through log
Time Since Uptime
The time the event occurred. A time of 0 is the time the
system was last rebooted
Severity
The severity of the event, showing how serious event is:
Information, Warning, Critical, or the event type (e.g.
Connection Flow)
Source
The system module reporting the event
Description
Complete description of circumstances of event
Navigating the Event Log
The following is the description of the buttons used to navigate the event log.
The description of the keys controlling the Full Event Log page:
Table- 7.3
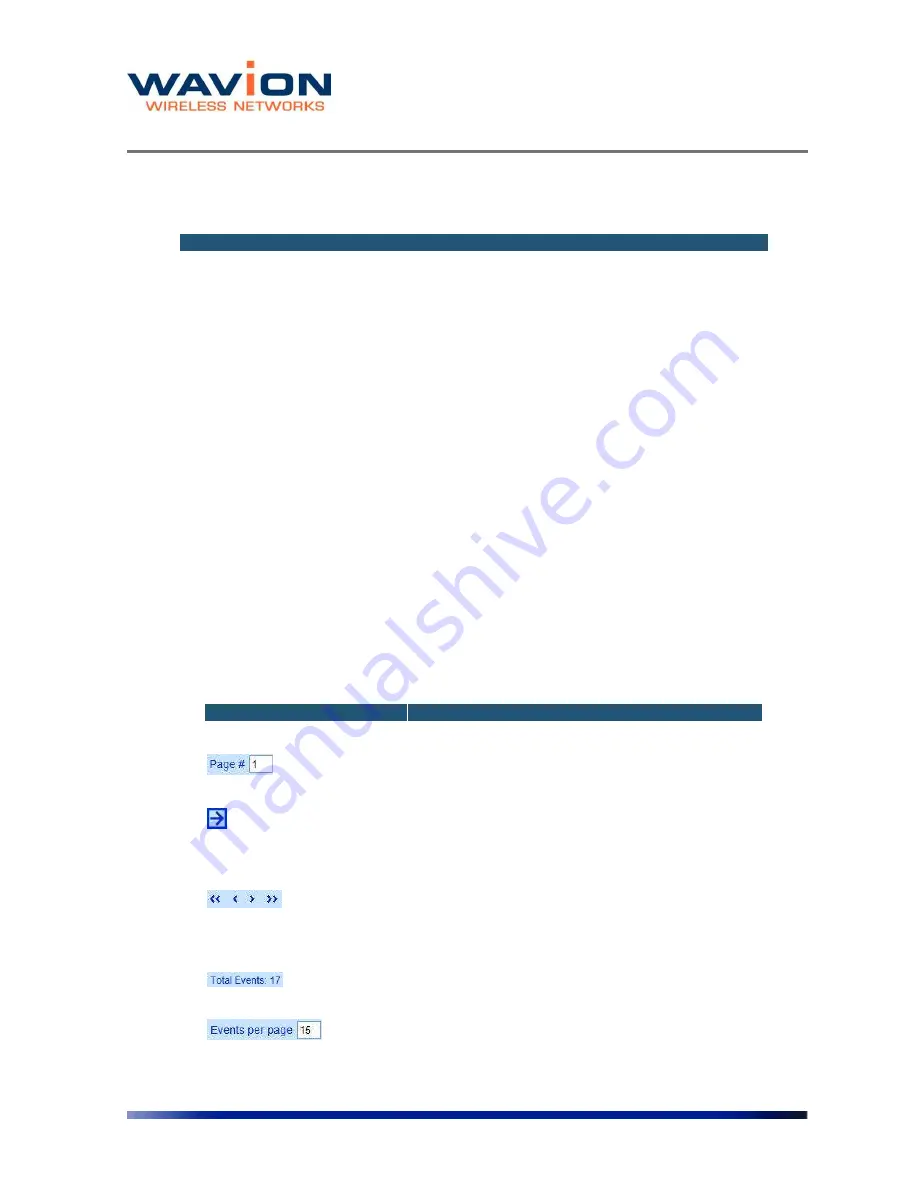
Viewing the Full Event Log page
Key
Description
Page#
Indicated the number of the page that is currently
viewed. The user may type the desired page # directly
without the need to scroll through all pages.
Arrow in square mark
is an Enter button. It is used to effect the change of the
page number entered by the user.
Arrows to the Left or Right
are used as scrolling buttons. An arrow to the right is
forward (older), and an arrow to the left is
backwards(newer). Note that the going forward in the
file means that old events are displayed. One arrow
indicates simple forward or backward. Two arrows jump
directly to the first or last page.
Event Count
indicates the total number of events that are in the
internal file
Events per page
The number of events shown on a page. The user my
change this value and hit the Arrow-in-a-square to
activate the change. By default, there are 15 events per


