


8.6
Bar Graph for the 2-point Scale
You can set two points for the limit function, and display a bar graph to indicate the result in a range
specified by the two points.
All of the weighing machine, parts counting, percentage weighing, and unit converting functions
support this function.
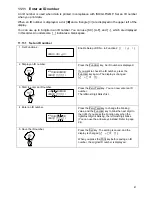
1 Set Function 1.
Set the 2-point scale [
] for Point Scale [
],
and Bar graph for the 2-point scale [
] for How to
Display Results [
] in Function 1.
2 Set upper and lower limits.
You can put actual samples on the balance or enter
values to set upper and lower limits.
You can also judge by absolute values or deviation
values.
A bar graph is displayed in one of the following ways:
Bar graph
Weight range
Description
Lower limit > Weight
A bar graph is not displayed.
Lower limit
≤
Weight
≤
Upper limit
A bar graph to indicate the
judgment result is displayed.
Weight > Upper limit
The whole bar graph is
displayed.
Caution:
1. When the lower limit is the same as the upper limit, a bar graph is not displayed.
2. When a 2-point bar graph is being displayed, a normal bar graph to indicate the rate of a
weight to the weighing capacity is not displayed.
3. When a 2-point bar graph is being displayed, the limit function does not work.
Hints
The frame of the bar graph differs depending on whether the balance is in measurement mode, 3
or 4 points are set for the limit function, or it is a 2-point bar graph, as shown below:
Bar graph frame
Balance condition
Measurement mode
Limit function (1- or 2-point scale)
Limit function (3- or 4-point scale)
2-point bar graph
33


