


2-14
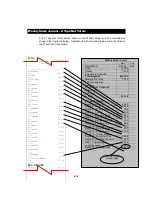
SMOOTHIES
21.00 73.37
5.49
%71.8
RETAIL
1.00 45.25
45.25 %28.1
-----------------
ALL MAJORS
22.00 160.56
Maj Group Name
Total Qty Total $
Average Sale Percent of Total Sales
Maj Group Name
Total Qty Total $
Average Sale Percent of Total Sales
----------------
ALL MAJORS
Total Qty of Major Groups Total $ of Maj Grp
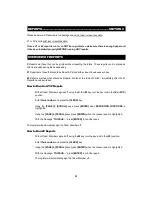
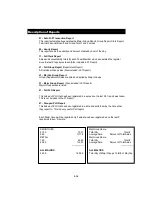
Description of Reports
01 - Auto Full Transaction Report
This report automatically generates the Major Group Report, Group Report, Clerk Report,
Terminal Financial Report, and Grand Total 1 and 2 values
06 - Hourly Report
This report shows the quantity and amount of sales by hour of the day.
11 - Full Clerk Report
Sales and accountability totals for each Team Member who has operated the register
since the last Z report was taken (Also included in 01 Report)
21 - Full Group Report (Department Report)
All Individual Group sales (Also included in 01 Report)
21 - Maj Grp Group Report
Group (Department) Sales are listed and sorted by Major Groups
31 - Major Group Report (Also included in 01 Report)
Major Group sales are listed
41 - Full PLU Report
This lists each PLU that has been registered in a sale since the last Z 41 report was taken.
This is not included in the 01 Report
47 - Grouped PLU Report
This lists each PLU that has been registered in a sale and sorts them by the Group that
they report to. This is a very useful PLU report.
Each Major Group will be reported only if sales have been registered since the last Z
report was taken. Sample: