


⎯
92
⎯
6 F 2 S 0 7 1 5
④
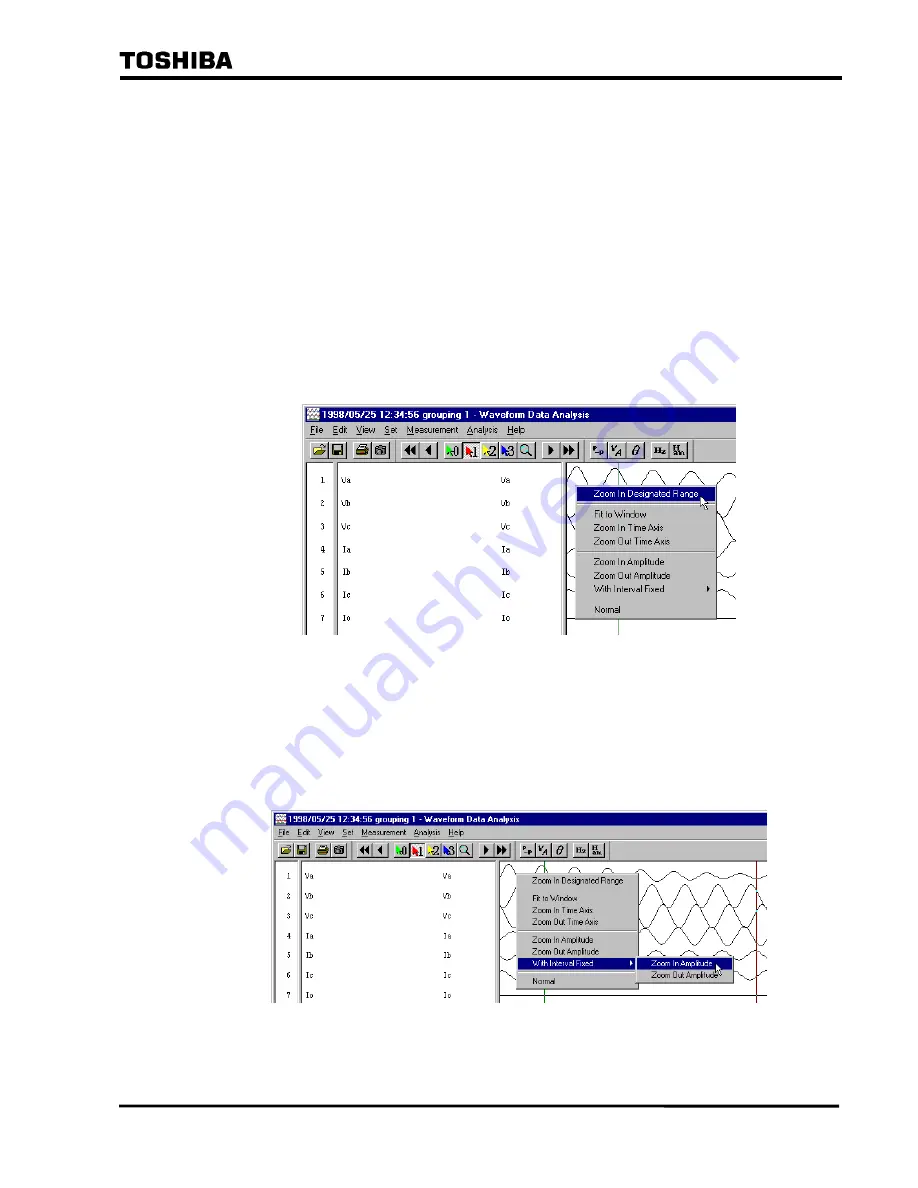
To display the waveforms from the beginning to the end in a screen, click [View], and
then click [Fit to Window].
⑤
To zoom in or out the time axis, click [View], and then click [Zoom In Time Axis] or
[Zoom Out Time Axis] respectively.
⑥
To zoom in or out the amplitude of waveforms, click [View], and then click [Zoom In
Amplitude] or [Zoom Out Amplitude] respectively.
⑦
To display the waveforms in the normal status, click [View], and then click [Normal].
※
The operations can be performed by clicking the analysis screen with the right button
on the mouse and select the item in the displayed menu as well.
⑧
To zoom in or out the amplitude of the selected waveform only, click the waveform
that you want zoom in or out with the right mouse button on the mouse and click [With
Interval Fixed].
On the menu displayed additionally, click [Zoom In Amplitude] or [Zoom Out
Amplitude].
・
When the selected waveform is one of a three-phase circuit, the other phases are zoomed in or out to the
same scale. However, when a zero-phase is selected, the only selected waveform is zoomed in or out.
1-16
Summary of Contents for RSM 100
Page 29: ... 28 6 F 2 S 0 7 1 5 ...
Page 70: ... 69 6 F 2 S 0 7 1 5 Appendix A Menu Tree ...
Page 72: ... 71 6 F 2 S 0 7 1 5 Appendix B Waveform Data Analysis Instruction Manual ...
Page 82: ... 81 6 F 2 S 0 7 1 5 The waveforms of the selected waveform data are displayed 1 5 ...
Page 149: ... 148 6 F 2 S 0 7 1 5 Memo 2 36 ...
Page 158: ... 157 6 F 2 S 0 7 1 5 Memo 3 9 ...
Page 159: ... 158 6 F 2 S 0 7 1 5 Waveform Data Analysis Instruction Manual FF02757 01 3 10 ...
Page 160: ... 159 6 F 2 S 0 7 1 5 Appendix C Saving Method of RSM Setting Data ...
Page 163: ... 162 6 F 2 S 0 7 1 5 ...
Page 164: ... 163 6 F 2 S 0 7 1 5 Appendix D Q A ...
Page 173: ......