


40
The rules (formulas) can be entered with a QC rule editor. The editor contains the following items:
Sample
– Select the sample to be checked. It can be any of the calibrators or controls present in
the layout or the blank. If the sample has replicates, the average value of these is automatically
selected for the QC check. Both raw and calculated data of a sample can be used as criteria.
Operator
– One of the following can be chosen to be used in the formula: +, -, *, /, (, ), > or <.
Constant
– A constant can be entered with the number keys on the keypad.
Function
– SD or CV% of a sample can be added. SD calculates the standard deviation of the
sample. CV calculates the coefficient of variation of the sample.
Delete
deletes the created formula digit by digit.
For instructions on how to add a QC rule to a protocol, refer to “Adding a QC rule to the protocol”.
Results menu
You can view the results of a measured run (assay) in several formats in the
Results
menu,
depending on the protocol settings in the
Processing
menu: raw data in list and table format,
calculated results in list and table format, and graphs (calibration and kinetic curves).
The assay data that is linked to the protocol consists of raw data and all the information needed for
calculations programmed in the
Main
and
Processing
menus.
The result of the previously run assay protocol (measured protocol) is shown as default (if exists).
When another protocol is selected from the
Main
menu, the result view is cleared to avoid any
conflicts.
Note!
The instrument measures the absorbance with four decimals. Absorbance data is
presented with three decimals. However, all measured decimals are used in further calculations.
Note!
Results over 4 Abs are calculated but they are struck through, and interpretations for
these results are not given.
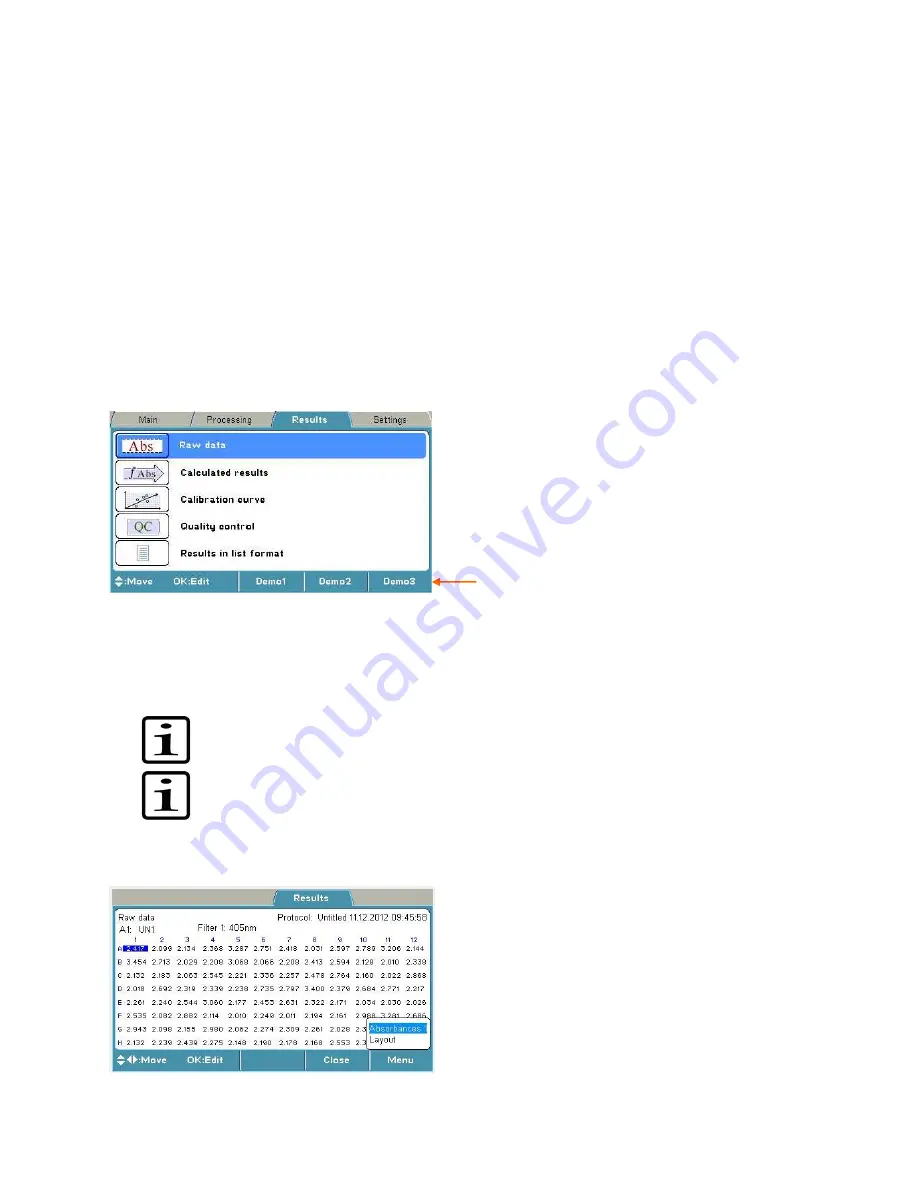
Raw data
You can see the unprocessed data (raw absorbances) of the assay in the
Raw data
window.
Info text bar


