


Plotting Telemetry Data
8
SNVA481B – October 2011 – Revised January 2020
Copyright © 2011–2020, Texas Instruments Incorporated
AN-2143 LM5064 Evaluation Kit
8
Plotting Telemetry Data
To enable telemetry data plots click on the sine wave icon located on the LM5064 block representation.
After enabling the telemetry, a prompt will appear requesting entry of the GUI sample rate, plot rate, and
plot depth. For most cases the default rates and depths will be acceptable. The plotting tool allows the
user to select the desired data to be plotted. Up to two different parameters may be plotted at the same
time as shown in
.
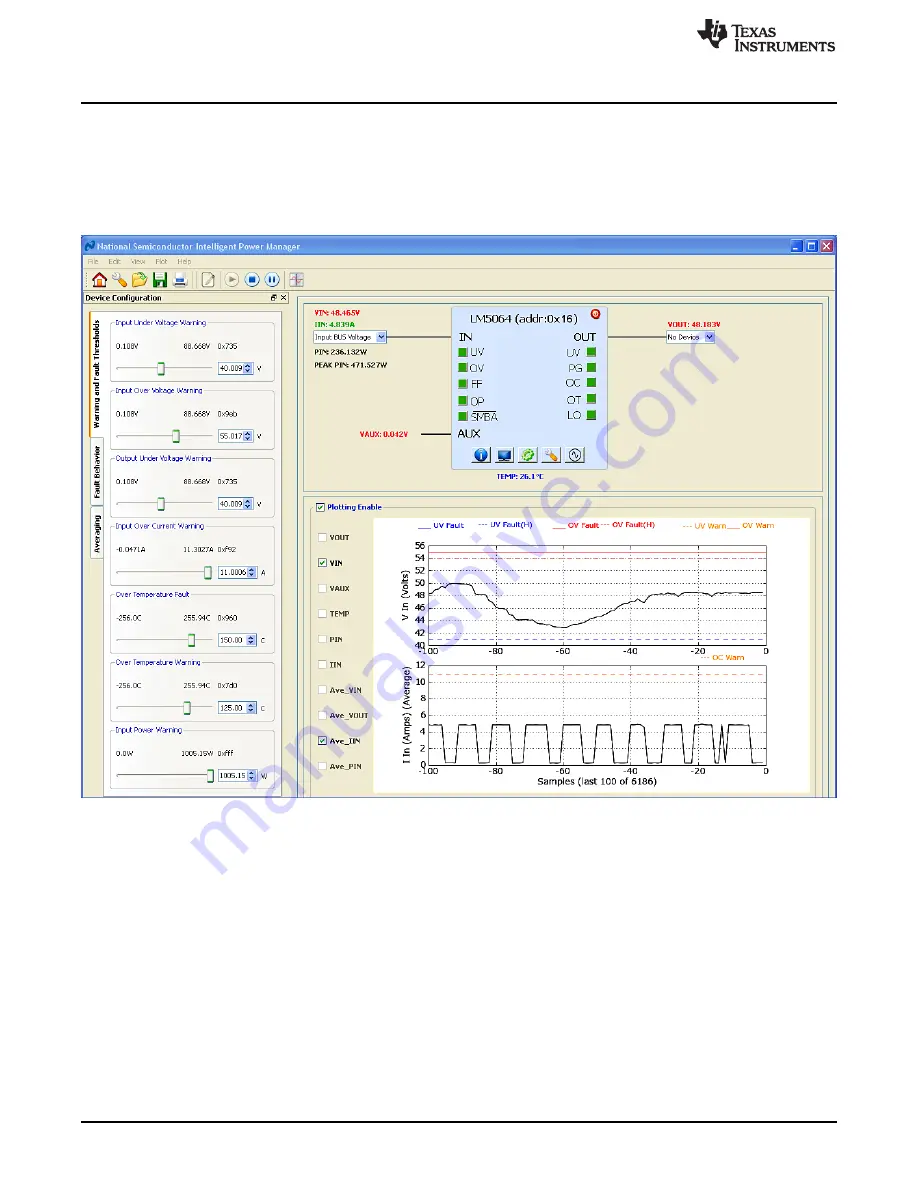
Figure 8. LM5064 GUI with Telemetry Plotting Tool Enabled
Device telemetry data is plotted as a black line that continually updates as the device is queried. In
addition to the device data, the relevant warning and fault thresholds are also plotted. Warning thresholds
are shown as orange lines while fault thresholds are shown in red and blue.
By going to the plot menu option the user can disable the plotting grid as well as the warning and fault
lines.
9
Configuring the LM5064 Device
Warning Thresholds, Temperature Fault Threshold, Protection Ranges, Fault Masking, and Averaging can
be configured in the Device Configuration panel. This panel, shown in
, is enabled by clicking the
gear icon shown on the LM5064 block representation.