Serial Decode
Using the Result Table
Besides displaying the decoded serial data, the result table helps you to inspect the acquisition.
Zoom & Search
Touching any cell of the table opens a zoom centered around the part of the waveform corresponding to the index.
The Z
n
dialog opens to allow you to rescale the zoom, or to
the acquisition. This is a quick way to navigate to
events of interest in the acquisition.
Tip: When in a summary table, touch any data cell
other than
Index and Protocol to zoom.
The table rows corresponding to the zoomed area are highlighted, as is the zoomed area of the source waveform.
The highlight color reflects the zoom that it relates to (Z1 yellow, Z2 pink, etc.). As you adjust the zoom scale, the
highlighted area may expand to several rows of the table, or fade to indicate that only a part of that Index is shown in
the zoom.
When there are multiple decoders running, each can have its own zooms of the decoding open at once. In this case,
multiple rows of the summary table are highlighted to show which indexes are shown in the zooms. These highlights
will be different colors to indicate which rows correspond to each decoder.
Note: The zoom number is no longer tied to the decoder number. The software tries to match the numbers,
but if it cannot it uses the next empty zoom in the sequence.
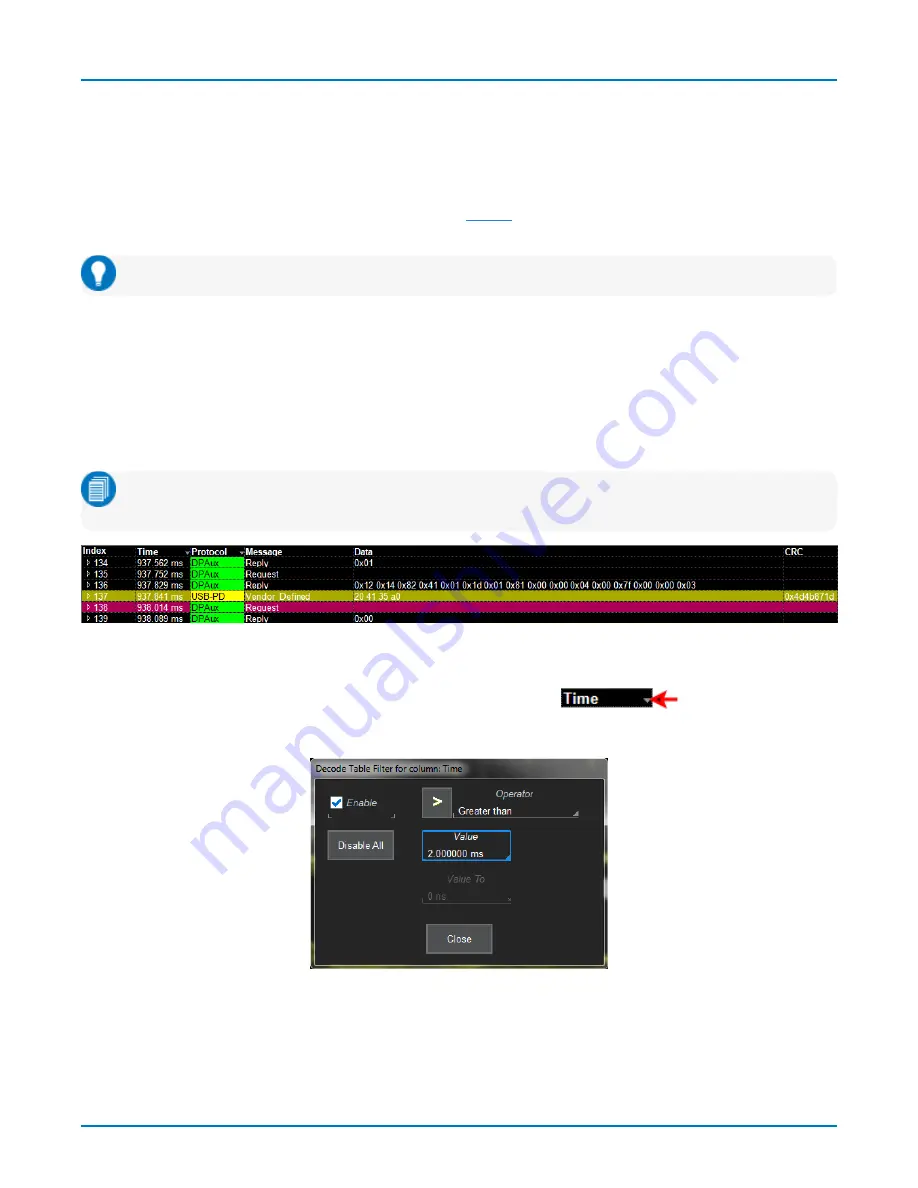
Example multi-decoder summary table, both indexes highlighted.
Filter Results
Columns of data with a drop-down arrow in the header cell can be filtered:
Touch the header cell to open the Decode Table Filter dialog.
Select a filter Operator and enter a Value that satisfies the filter condition.
13