


83
Temperature/Humidity Graph
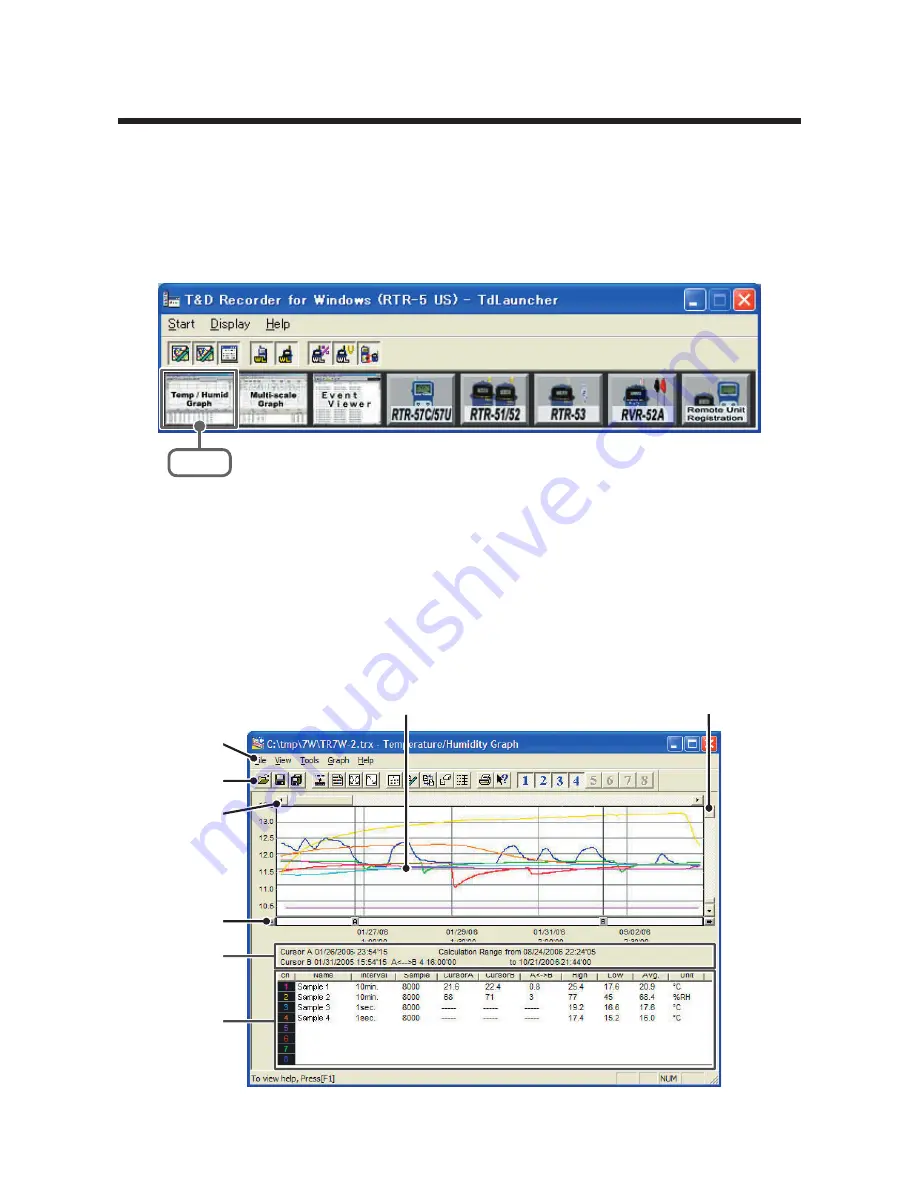
Here operations can be carried out to view in graph form the
temperature and humidity data recorded by RTR-
5
Series Data
Loggers.
Open the Graph display by clicking the icon [Temp/Humid Graph] in
the Main Window.
Click
Note
- In the Main Window or in the Settings/Communication Display of [RTR-
57
C/
57
U],
[RTR-
51
/
52
], or [RTR-
53
], select the [Temp/Humid Graph] from the [Start] menu to
open the graph.
- If you have clicked [Display the graph after downloading recorded data], the graph
will automatically open.
■
Display Names and Functions
⑧
①
②
⑤
③
④
⑦
⑥


