38
39
About Menus
2.
The time of recorded data will switch to the measurement, a few
seconds after you stop scrolling.
3.
The measurement shown in 2 is the value of the point located at the
center of the graph.
4.
The bar on the bottom of the graph shows the portion of the data in
the view window.
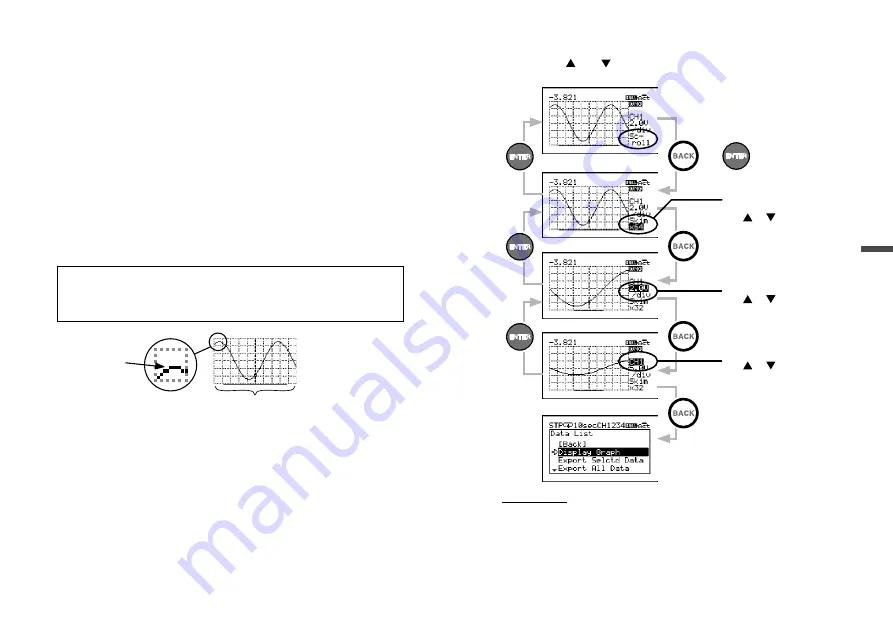
Tapping <ENTER> allows you to change 5, 6 and 7.
5.
Recording Channel
Select the desired channel to view a graph. If the displayed channel
has not been used for recording, you will see the “No Record”
message.
6.
Vertical Axis Scale
Set scaling value for Y-axis divisional boxes.
EX) “2.0V/div” shows that each vertical division represents 2.0 V.
7.
Skimming Level (Horizontal Axis Scale)
Set skimming level for X-axis divisional boxes.
Skim×1 : The space between dots (data points on graph) is same as
the recording interval value
Skim×n : The space between dots (data points on graph) is “n” times
the recording interval value
The horizontal axis of
the graph display shows
a total of 100 dots.
(10 dots per box) × 10 boxes = 100 dots
There are ten data
points (dots) in
each divisional box.
Enlarged View
EX1) When recording interval is 10 ms and skimming level is “×1”:
Each horizontal divisional box represents 100 ms (10 ms × 1 × 10
dots) with the total screen width showing 1 sec (100 ms × 10
boxes) of recorded data.
EX2) When recording interval is 10 ms and skimming level is “×2”:
Each horizontal divisional box represents 200 ms (10 ms × 2 × 10
dots) with the total screen width showing 2 sec (200 ms × 10
boxes) of recorded data.
Use <ENTER> and <BACK> to move to the target item, then change
the value with and .
Skimming Level
(Horizontal Axis Scale)
Use or to change.
Scroll Screen
Change Screen
Menu Screen
or
Vertical Axis Scale
Use or to change.
Recording Channel
Use or to change.
IMPORTANT
When changing settings as above, if no operations are performed or a change is not
confirmed with <ENTER>, the change will automatically be applied and the graph will
return to the “Scroll” mode.


