


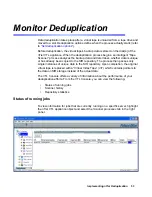


Monitor Deduplication
Implementing nTier Deduplication
56
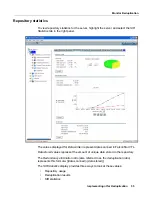
Repository
usage
This section of the display shows the current state of the physical disk used as the
SIR repository, which includes SIR data and SIR Index storage. Values are based on
all tape scans performed during the life span of the selected server.
Disk Usage
values show how much disk space has been allocated to each SIR
storage component and how much space has been used.
The
Repository object capacity
graphic represents memory usage.
Select
Refresh
to update the display to include activity that has occurred since the
last refresh.
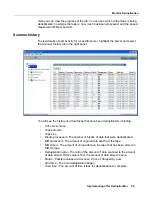
Deduplication
results
This section of the display combines
data written
and
data stored
statistics for all
accumulated data to show deduplication activity over time. Viewing data in this way
allows you to calculate the redundancy elimination ratio for any period of time.
Reviewing deduplication operations for successive weeks of full backup reveals the
true redundancy ratios of week-to-week data evolution and can be used to
accurately forecast repository requirements. You can identify how quickly you are
using your repository disk space and when you are likely to need to add more.
Select a
Unit of time
from the drop-down list to adjust the granularity of the graph.
Use the arrow buttons to scan through accumulated data. Click
Refresh
to include
data for deduplication activity that has occurred since the last refresh.
SIR statistics
This section of the display shows current statistics: a view of the redundancy
elimination ratio based on tape scans performed since a user last reset the display.
For example, statistics might reflect 7 days, 1 hour, 2 minutes, and 2 seconds of SIR
deduplication processing, during which 125 GB of data was scanned by SIR. 45 GB
of data was unique and therefore stored in the repository, resulting in a redundancy
elimination ratio of 2.8:1.
Statistics are automatically updated every 30 seconds. You can click the
Reset
button to reset values to zero and reset the time to the current time. Subsequent
updates will reflect activity since the reset. If you view the display after a few
minutes, the redundancy elimination ratio will reflect tapes currently being scanned.
Note:
It is not uncommon to see a ratio of 1000:1 for a particular tape; this simply
indicates that extremely little data has changed.


