


WATTrouter Mx - user manual
How to fit and setup the device
Page 47 from 82
equipped with a compatible impulse output. It is also necessary to configure the "Measurement
source" field on the Input settings tab for this ANDI input, in order to let the controller process the
counted value properly.
Values are approximate! The device does not know the exact values from utility/billing meters!
Daily statistics are reset every time just after midnight, i.e. at 0:00 A.M. At the same time, daily
values from the just finished day are moved into history. When you change the date in the
controller you may cause irreversible deletion of stored history!
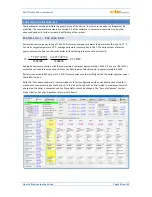
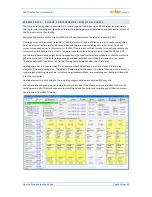
Daily statistics:
Show for day –select the date for which to view daily statistics. You can display them for current date
and last 31 days.
Phase Lx–displays information about the surplus (excess) energy, normal and low price energy tariff as
well as (optionally) PV-production, when counted with an ANDI input, in the current or selected day.
Total L1+L2+L3 – displays summary data from all three phases. The calculation of these data depends
on the selected control mode -the "Control mode" field on the Other settings tab:
a.
Each phase independently – summary data are simply the sum of the fields from all 3 phases
b.
Sum of all phases – summary data are updated continuously from immediate results.
In this
control mode summary data are not the simple sum of the displayed values in each phase
(in one phase the surplus energy may cover consumption in different phase, etc.).
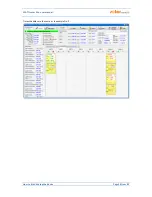
Daily output status- displays the assumed or really measured amount of energy supplied to each load
in the current or selected day.
Since the statistics are reset every time just after midnight, these
values will not correspond with the values in the fields "Supplied energy"
(reset of those fields is
generally done at different time).
Daily ANDI input status- displays the measured energy at corresponding ANDI input in the current or
selected day. In brackets on the right, the configured measurement source is also displayed. If ANDI
input is configured to measure temperature, the item always remains zero. Temperatures are not
counted in stats.
Read from SD card – use this button to read more detailed statistics from the built-in SD card. These
statistics will be saved to a *.csv file which you can load e.g. in MS Excel.
Erase internal stats – use this button to delete all statistics stored in the built-in EEPROM memory.
Confirmation dialog will be shown first.
Erase SD card stats – use this button to delete all statistics stored in the built-in SD card. Confirmation
dialog will be shown first.
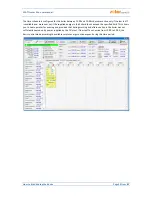
Charts – they show a graphical interpretation of the daily statistics on production and consumption.
Charts in each phase indicate the part of corresponding summary data (pie slice or part of the bar).
The self-consumption value is calculated from this formula: self-consumption = production – surplus
energy. Self-consumption values are not available unless the displayed production value is bigger than
measured surplus energy value.
Note
: For very small energy values (typically immediately after resetting statistics after midnight) internal
rounding to 0.01kWh is significant for displaying the charts .In these cases, pie charts may not be displayed
absolutely correctly.
Weekly statistics:
Chart -shows the5 main summary data (production, surplus energy, self consumption, consumption in
normal and low tariff) in bars for the last 7days.Double click on the bar to view the day in the daily
statistics.
Monthly statistics:
Production chart - displays summary data on production (prodsurplus energy) in the last 31
days. Double click on the bar to view the day in the daily statistics.