


26
3.5.5
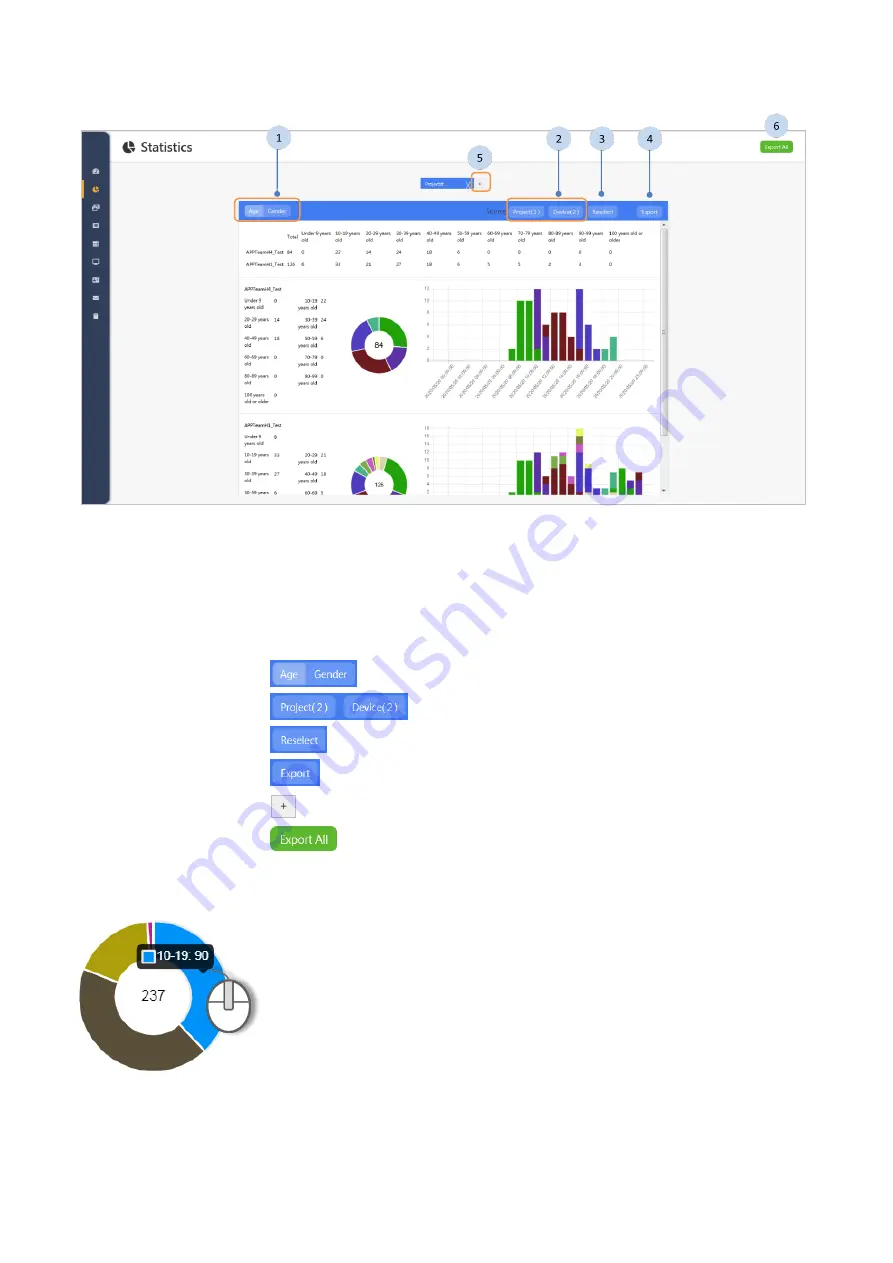
Analysis
Result
S
Analysis results are displayed on the page, each table displays two columns of
charts, and you can view the statistical results as required.
Steps
1
Click on the
button to toggle between the analysis results.
2
Click on the
button to show the source of the analyzed.
3
Click on the
button to reselect a source, if required.
4
Click on the
button to export analyzed data.
5
Click on the
button at the top of the page to add an analysis table.
6
Click on the
button to export all tables, if required.
Tips
Move your mouse over the pie chart and bar chart
to display the meaning of each part.