


•
To select a specific part of the data to zoom in on, pull the mouse pointer
diagonally.
•
Push
Auto Range
to see the data for each selected parameter. The software
adjusts the scale so that the data will always show.
•
Push
Default Ranges
to go back to the manufacturer-set default scale for each
parameter.
•
Put a check in the box next to "Show Data Points" to see the value of the
collected data when the mouse moves over each point.
•
Push
Select Sensors To Display
to change the parameters to look at in the
Time Series
graph.
5.
Let the sensor or sensors collect data for approximately 5 minutes.
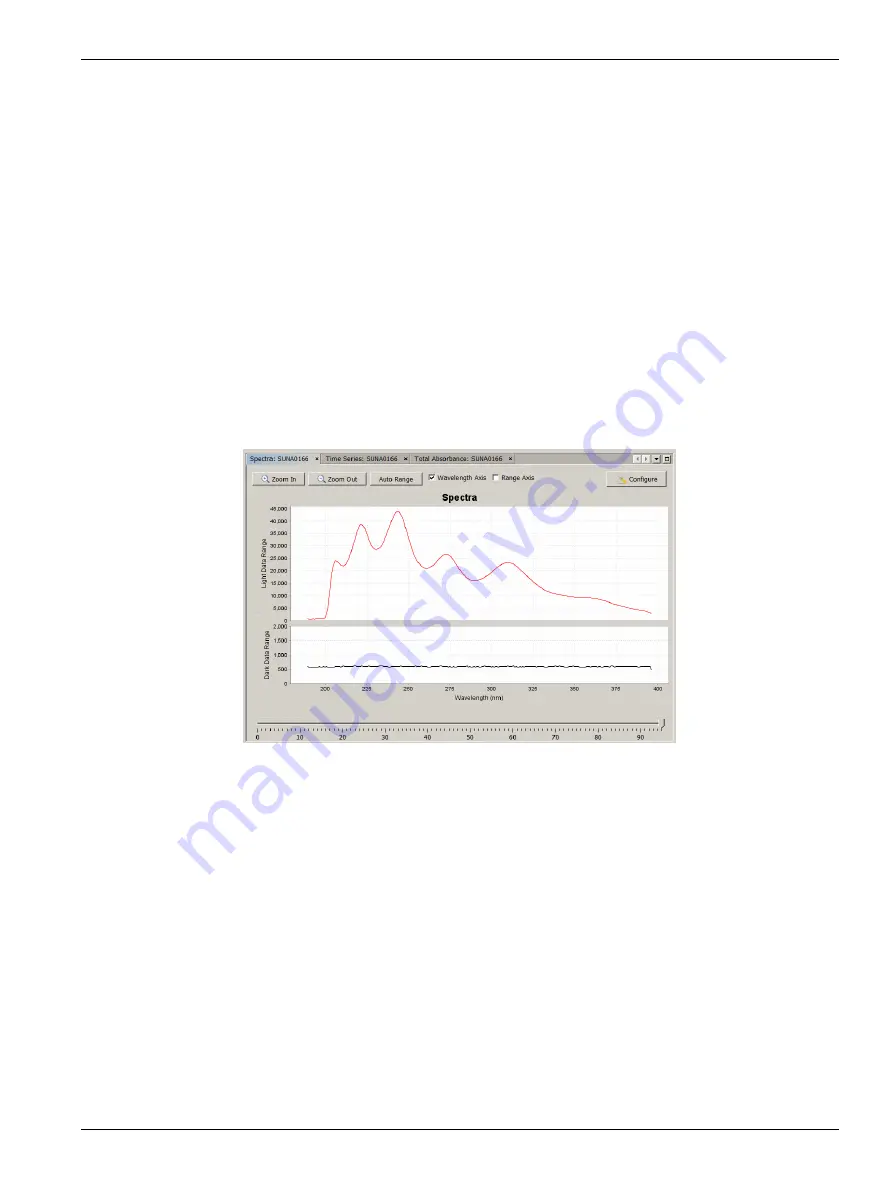
3.4.1 Monitor data in spectra graph
The
Spectra
graph shows both the dark and light data in raw counts.
The dark counts are from thermal noise. The light counts are the measured output minus
the dark counts.
The measured spectrum is always flat below 200 nm, and then has four or five peaks.
The peaks are approximately 25 nm apart in the lower wavelength range and up to 50 nm
apart in the upper range.
3.4.2 Monitor data in time series graph
The
Time Series
graph shows the nitrate concentration and any selected optional values.
Use this graph to replay data that is stored in the sensor.
Set up sensor and verify operation
9
Summary of Contents for SUNA V2
Page 2: ......
Page 6: ...SUNA quick start guide 4 ...
Page 14: ...Set up sensor and verify operation 12 ...
Page 16: ...Deployment and recovery 14 ...
Page 22: ...Transmit data 20 ...
Page 42: ...Reference 40 ...
Page 48: ...Software reference 46 ...
Page 52: ...General information 50 ...
Page 53: ......