H1 Series
- 43 -
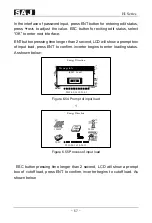
In the figure above, it shows the daily output in all days in this month.
Day Buy Energy
2019-09-16 18:26:31
0
3
6
9
12
15
18
21
24
Day
kWh
1.0
2.0
3.0
4.0
5.0
6.0
7.0
8.0
9.0
10.0
27
30
E-Month: 0.00kWh
Buy
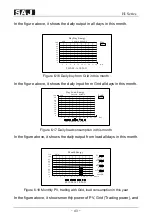
Figure 6.16 Daily buy from Grid in this month
In the figure above, it shows the daily input from Grid all days in this month.
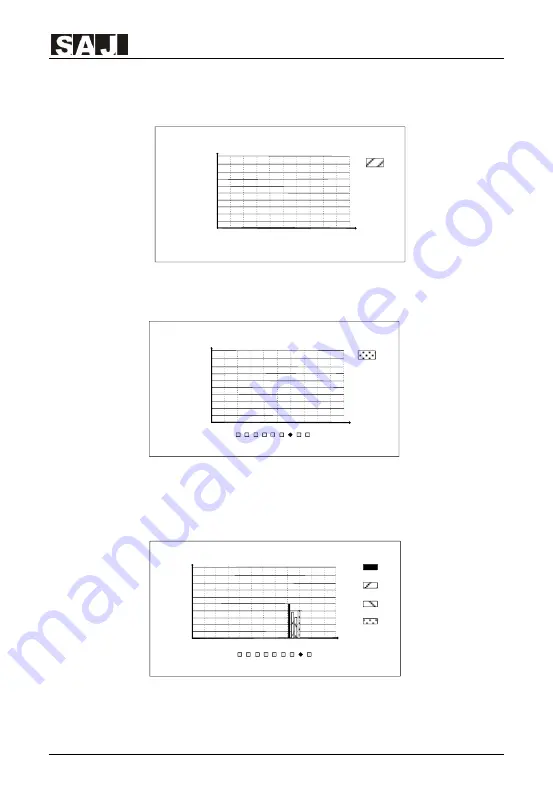
Day Load Energy
2019-08-14 18:26:31
0
3
6
9
12
15
18
21
24
Day
kWh
1.0
2.0
3.0
4.0
5.0
6.0
7.0
8.0
9.0
10.0
27
30
E-Month: 0.00kWh
Load
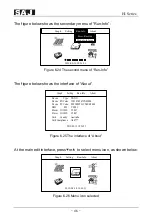
Figure 6.17 Daily load consumption in this month
In the figure above, it shows the daily output from load all days in this month.
Month Energy
2019-08-14 18:26:31
1.1
2.2
3.3
4.4
5.5
6.6
7.7
8.8
9.9
10.0
11.0
0
1
3
4
5
6
7
Month
kWh
PV
E-Year
5.48kWh
Sell
E-Year
4.30kWh
Buy
E-Year
3.28kWh
Load
E-Year
4.46kWh
2
8
9
10 11
12
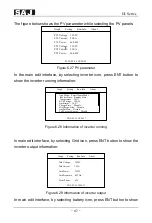
Figure 6.18 Monthly PV, trading with Grid, load consumption in this year
In the figure above, it shows monthly power of PV, Grid (Trading power), and
Summary of Contents for H1 Series
Page 1: ...H1 Series 0...
Page 35: ...H1 Series 34 5 8 Connection Diagram Figure 5 18 H1 Connection diagram...
Page 68: ...H1 Series 67...

