


23
Navigator Op Guide 051226.pmd
S
ECTION
S
IX
: U
SING
N
AVIGATOR
R
EMOTE
C
ONTROL
S
OFTWARE
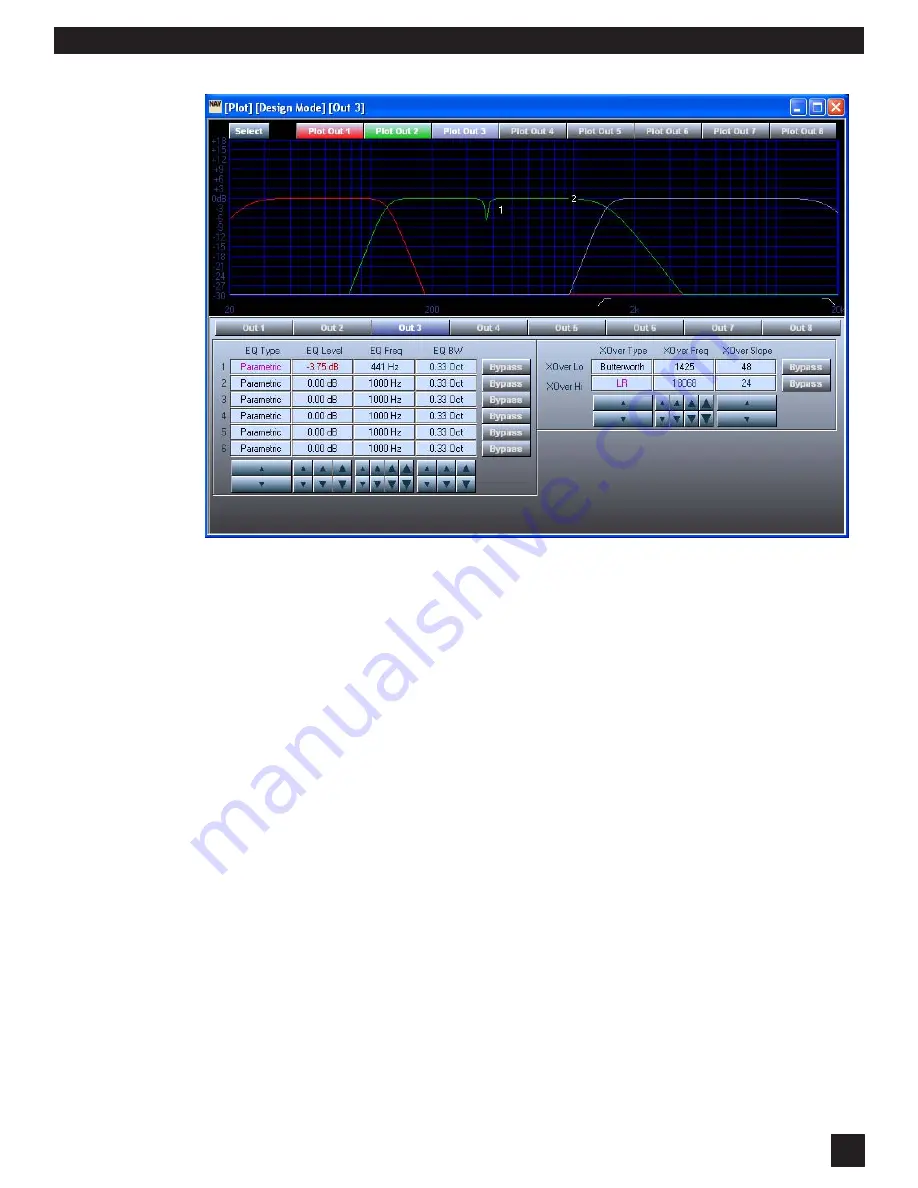
Guide to Crossover Screen Controls:
•
Select/Single
: Thjis button toggles your view of the output response curves of your Naviga-
tor. Choosing Select allows you to see multiple curves on the same screen. Choose
Single if you only want to see the output selected for editing.
•
Plot 1-8 Out:
When in Select mode (as described above) these buttons allow you to choose
which output curves will be displayed in the response curve window.
•
Out 1-8
: These buttons select which output you are editing. All controls on the lower half of
the screen, and all graphic editing is done on the selected output. Select Output first!
•
EQ Type
: Choose between Parametric, Low Shelf, and HIgh Shelf using the arrows at the
bottom of this column. You must choose a type before any editing.
•
EQ Level
: Set levels using the arrows at the bottom of the column (note the three sizes for
coarse or fine adjustments) or you can edit the filter level graphically by using your mouse
and grabbing the filter number.
•
EQ Freq.
: Set filter center points using the arrows at the bottom of the column (note the
three sizes for coarse or fine adjustments) or you can edit the filter frequency graphically
by using your mouse and grabbing the filter number.
•
EQ BW
: Set the bandwidth of each filter using the arrows at the bottom of the column (note
the three sizes for coarse or fine adjustments) or you can edit the filter width graphically
by using your mouse and grabbing the handles next to the filter number.
•
XOver Type
: Sets the type of filter you will use for each of the crossover filters in the
selected output. Use the arrows below the column to choose the type -- your first step
first before any other editing of the crossover.
•
XOver Freq.
: Set the frequency at which the filter roll-off begins using the arrows at the
bottom of the column or you can edit the filter frequency graphically by using your mouse
and grabbing the low or high filter icons that will appear at the bottom of the plot.
•
XOver Slope
: Set the slope of the filter by using the arrows at the bottom of the column or
you can edit the slope graphically by using your mouse and grabbing the handle that
appears next to the filter icons at the bottom of the plot.