background image


7 Windows/Dialogs 


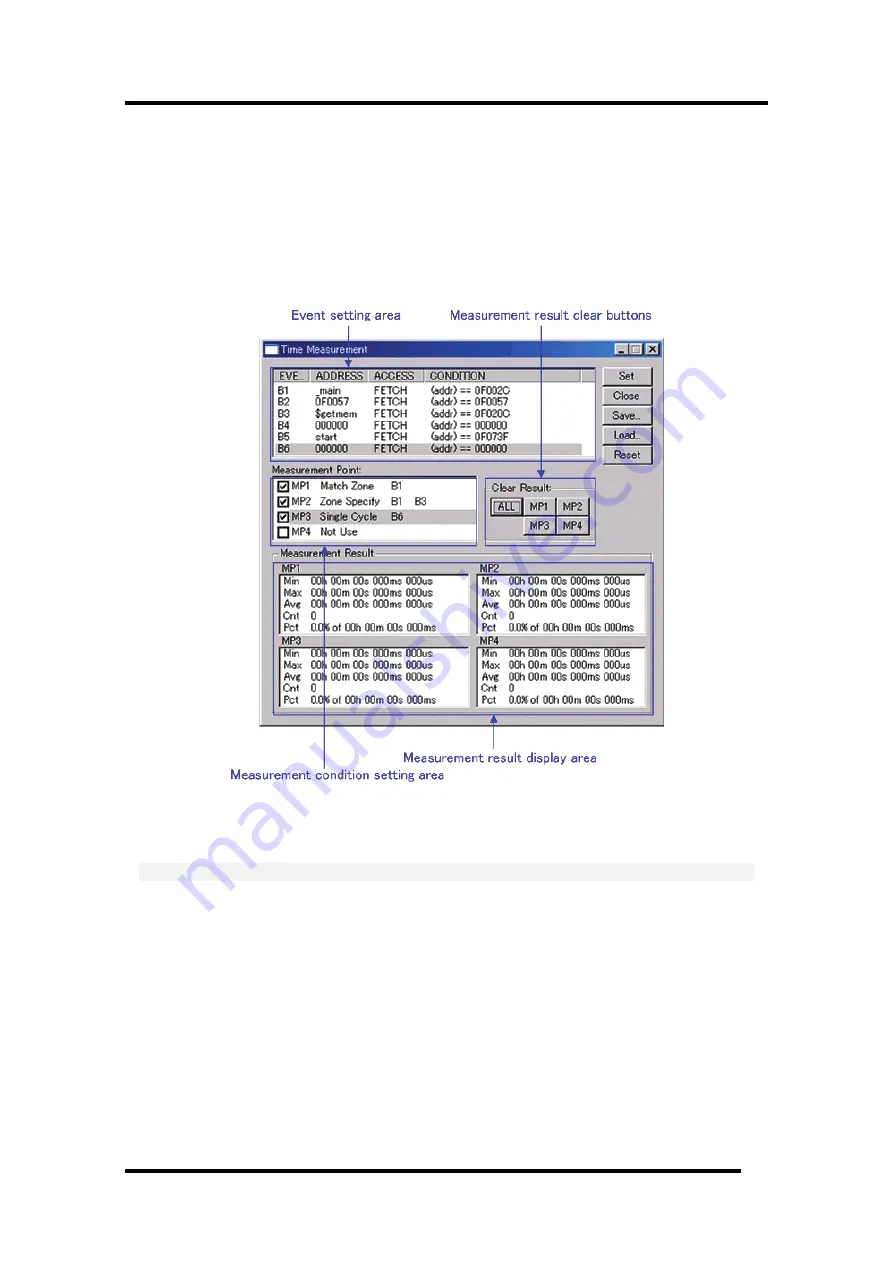
7.10 Time Measurement Window 

The Time Measurement window displays the minimum/maximum/average execution time and 
measurement count at any measurement point. The execution time of up to 4 measurement points 
can be measured simultaneously. 
You can specify the event for the measurement condition in the same manner as when specifying 
events in the Trace Point Setting Window. 


• 

If the contents of events are altered, they are marked by an asterisk (*) on the title bar. The 
asterisks (*) are not displayed after setting up the emulator.   


ATTENTION 

• 

The Trace Point Setting Window and the Time Measure Windows use the same resource of the 
emulator. If the event settings are modified in Time Measure Window, settings of the Trace Point 
Setting Window are modified, too. 

• 

As the count resource for time measurement, specify the MCU cycle (operation clock of the target 
mcu) instead of the emulator clock (16MHz), in the init dialog. If you specify the emulator clock, 
the measurement result will be incorrect.   


159 

Summary of Contents for Emulator Debugger M16C PC4701

Page 1: ...ok over all the business of both companies Therefore although the old company name remains in this document it is a valid Renesas Electronics document We appreciate your understanding Renesas Electron...

Page 2: ...t for an application categorized as Specific or for which the product is not intended where you have failed to obtain the prior written consent of Renesas Electronics The quality grade of each Renesas...

Page 3: ...M16C PC4701 Emulator Debugger V 1 03 User s Manual User s Manual Rev 1 00 2007 07 Renesas Microcomputer Development Environment System...

Page 4: ...such as safety systems or equipment or systems for transportation and traffic healthcare combustion control aerospace and aeronautics nuclear power or undersea communication transmission If you are co...

Page 5: ...help explains the function as a debugger of High performance Embedded Workshop Target System The Debugger operates on the emulator PC4701 system Supported CPU This help explains the debugging function...

Page 6: ...registered trademarks of Intel Corporation Adobe and Acrobat are registered trademarks of Adobe Systems Incorporated All other brand and product names are trademarks registered trademarks or service...

Page 7: ...11 3 Before starting the debugger 12 3 1 Communication method by emulator 12 3 1 1 USB Interface 12 3 1 2 LAN Interface 12 3 1 3 LPT Interface 12 3 1 4 Proprietary Parallel Interface 13 3 2 Download...

Page 8: ...Starting the Debugger 62 6 2 2 Step2 Checking the Operation of RAM 63 6 2 3 Step3 Downloading the Tutorial Program 64 6 2 4 Step4 Setting a Breakpoint 66 6 2 5 Step5 Executing the Program 67 6 2 6 Ste...

Page 9: ...the Events Bit Access 154 7 9 10 Specify the Events Interrupt 154 7 9 11 Specify the Events External Trigger Signal 154 7 9 12 Specify the Event Combination Condition 154 7 9 13 Specify the Process ID...

Page 10: ...7 18 1 Extended Menus 231 7 18 2 Refer the Execution History of Task Taskxx Window 232 7 19 Task Analyze Window 237 7 19 1 Extended Menus 237 7 19 2 Analyze the Execution History of Task 238 8 Table...

Page 11: ...257 10 1 17 Character String Literals 257 10 2 Display Format of C C Expressions 258 10 2 1 Enumeration Types 258 10 2 2 Basic Types 258 10 2 3 Pointer Types 259 10 2 4 Array Types 260 10 2 5 Function...

Page 12: ...er 272 12 3 10 CPU rewrite 272 12 3 11 MR STK script command 272 12 4 Attention of the 740 Debugger 273 12 4 1 Setting of Memory Map 273 12 4 2 Emulation Pod M37515T RPD 273 12 4 3 Stack area used by...

Page 13: ...Setup of Debugger 1...

Page 14: ...Blank Page 2...

Page 15: ...emulator system contains a 1 Kbyte RAM monitor area which cannot be divided into smaller areas This debugger supports the real time RAM monitor function which allows you to reference the memory data w...

Page 16: ...nment Sampling cycle depends on the following environments Communication interface Number of the RAM Monitor windows displayed Size of the RAM Monitor window displayed Number of ASM watch points withi...

Page 17: ...ion is based on the OR logic Arrival to any one of breakpoints breaks the target program 1 2 1 1 Setting of software breakpoint The software breakpoint can be set by the following windows Editor Sourc...

Page 18: ...ry access allows you to specify the comparison data to read write data related to the specified address in the same manner as when setting the H W breakpoint It also allows mask designation to the com...

Page 19: ...fy the following attributes in byte Access Disable Read Only R W Enable 1 2 3 2 Access Protect Area A protect area is a continuous 256 KB area starting from the 64KB boundary Its start address is call...

Page 20: ...information this mode allows source line or data access information to be displayed in combination Data access mode This mode allows you to inspect the data read write cycles In addition to data acce...

Page 21: ...entering a break state during state transition State Transition condition You can select specified task only or other than specified task as the trace condition to meet the real time OS 1 3 3 Trace D...

Page 22: ...of a specified zone With this debugger time can be measured up to four points simultaneously 1 4 1 The Measurement Condition The measurement condition of the zone time can specify the following in ea...

Page 23: ...surement function in the test process you can check for missing test items 1 5 1 Coverage Measurement Area The coverage measurement area is any continuous 256 KB area starting from the 64 KB boundary...

Page 24: ...e status of the realtime OS and inspect a task execution history etc The debugger for 740 can t show the status of the realtime OS 1 7 GUI Input Output Function This function simulates the user target...

Page 25: ...4701M PC4701HS USB Support LAN Support Support LPT Support Support Proprietary parallel Support Support Serial Support Support Depending on communication methods it is necessary to set up some items b...

Page 26: ...with the emulator via a LAN on Windows Windows registry information must partly be modified The PC4701U emulator in a LAN can be connected to the PC4701Us on another network connected to the LAN via...

Page 27: ...d interface board the PCA4202G02 incorporated in it only the ISA bus is supported The necessary cable is included with the emulator A device driver must separately be set 3 1 4 1 Serial Interface Supp...

Page 28: ...sion of the firmware downloaded to the emulator at start Also when the firmware downloaded to the emulator is of old version a mode which drives this debugger to download firmware is set When this deb...

Page 29: ...the emulator s communication interface switch to the USB position Then turn on the power to the emulator 3 The dialog box shown below appears Go on following the wizard and a dialog box for specifyin...

Page 30: ...er the IP address in the emulator follow the procedure described below 1 Connect the emulator with LAN cable to the same network same subnet as the host computer is connected 2 Set the emulator s comm...

Page 31: ...are registered in the emulator When registered correctly the dialog box shown below appears After checking the contents of the dialog box click the OK button 7 Temporarily turn off the power to the em...

Page 32: ...authorized as an Administrator No one but the user who has the authority of an Administrator can install the device driver Note Windows XP 2000 TCP supports Selective Acknowledgments SACK as document...

Page 33: ...ugger or when you want to change the I O address for PCA4202G02 because of conflict with other devices please follow the procedure of the setting described below 1 Execute setPca4202 exe included with...

Page 34: ...container of project files Thus each workspace contains one or more projects and each project contains one or more files Workspaces allow you to group related projects together For example you may hav...

Page 35: ...case of Selecting an Existing Workspace select Open a recent project workspace or Browse to another project workspace radio button and select the workspace file hws Please refer to the following about...

Page 36: ...arget toolchain name when using the toolchain 3 Select the project type In the Project type list box select the project type to be used In this case select Application Please refer to the manual attac...

Page 37: ...n the setting for the real time OS when using the setting for the startup file heap area stack area and so on Please set required information and click the Next button The contents of a setting change...

Page 38: ...following dialog box is displayed 1 Selecting of the Target type In the Target type list box select the target CPU type 2 Selecting of the Target Platform In the Targets area the target for the sessi...

Page 39: ...configuration file name for each of the all selected target The configuration file saves the state of High performance Embedded Workshop except for the target emulator simulator The default name is al...

Page 40: ...te The files which will be generated by the High performance Embedded Workshop are displayed If you want to change the file name select and click it then enter the new name This is the end of the emul...

Page 41: ...In the Tool chain combo box select None In this case toolchain is not used When the toolchain has not been installed the fixed information is displayed in this combo box 3 Select the project type When...

Page 42: ...box is displayed 1 Selecting of the Target type In the Target type list box select the target CPU type 2 Selecting of the Target Platform In the Targets area the target for the session file used when...

Page 43: ...the target emulator simulator The default name is already set If it is not necessary to change please click the next button as it is This is the end of the emulator settings Exit the Project Generato...

Page 44: ...in IEEE695_IAR IEEE 695 format file When Using IAR toolchain IEEE695_TASKING IEEE 695 format file When Using Tasking toolchain ELF DWARF2 ELF DWARF2 format file When Using Renesas toolch in a ELF DWAR...

Page 45: ...refer to the upper table about the format name of a download module Enter the full path and filename of the download module in the Filename edit box Specifies the access size for the current download...

Page 46: ...dialog box for setting the debugger is displayed and the emulator will be connected When the dialog box is not displayed select Connect from the Debug menu 4 3 2 Ending the Emulator The emulator can b...

Page 47: ...log box vary with each product used For details click the desired tab name shown in the table below Product Name Tab Name The debugger for M32C The debugger for M16 R8C C The debugger for 740 MCU Exis...

Page 48: ...gger emulation pod you must create a new MCU file To do this see the following 5 6 Method of making MCU file 5 1 1 2 Setting of the Communication Interface The displayed data varies depending on the s...

Page 49: ...his self check the debugger displays the content of the error and is finished When the self check terminated normally the dialog box shown below is displayed When you click OK the debugger starts up d...

Page 50: ...r Specify whether or not to use the watchdog timer By default the watchdog timer is unused This specification exist for the M32C debugger only When debugging the target system that uses a watchdog tim...

Page 51: ...Usually select this method On demand method Debugging information is stored in a reusable temporary file on the hard disk of your computer Because the stored debugging information is reused the next t...

Page 52: ...memory consumption NC30 and NC308 have an option to treat the sizes of enumerator types as 1 byte and not as same size of int Note that NC30 and NC308 don t output the sizes of enumerator types in deb...

Page 53: ...enabled only when you click the Select radio button 5 1 3 2 Specify the Work Area In the Work Area Start Address field in the Work Area group specify the top address of the area to be used as the wor...

Page 54: ...e extension mode When you use a normal mode Please click the Normal radio button When you use extension mode 1 Please click the Mode1 radio button When you use extension mode 2 Please click the Mode2...

Page 55: ...and the data bank if Read Write is specified for the bank duplicated area In above cases a signal which can distinguish which bank accesses the bus information is not output Therefore the above functi...

Page 56: ...trace event Time measurement event MCU switches the bank to be accessed based on the value in the bank selection register A signal which can distinguish which bank accesses the bus information is not...

Page 57: ...al clock and External to set the external clock 5 1 5 2 Attempt to access memory during WAIT STOP mode The debugger for 740 does not have this setting Set this check on when the mcu needs to access me...

Page 58: ...execute the script command at start of Debugger click the Refer button to specify the script file to be executed By clicking the Refer button the File Selection dialog is opened The specified script...

Page 59: ...the PC4701U emulator Before USB communication can be performed the computer must have a dedicated device driver installed in it For details on how to install USB device drivers see 3 3 1 1Install of...

Page 60: ...d select a mode possible to use which give better performance automatically In some PC the debugger cannot detect the most suitable mode Check the mode which the LPT interface in the PC have and selec...

Page 61: ...ld and subnet mask in the SubNetMask field The emulator IP address must be registered in the network environment in advance When the PC7501 or PC4701U is used the Default Gateway area becomes effectiv...

Page 62: ...the emulator 5 2 3 3 LAN connection by couple 1 with emulator Emulators can be connected by LAN TCP IP to a commercially available LAN card inserted in a PC by using a cross conversion cable for 10BAS...

Page 63: ...the I O address Don t describe prefix which shows a cardinal number For detail about parallel board PCA4202G02 refer to PCA4202G02 Instruction Manual ATTENTION Combination of Windows and Parallel Inte...

Page 64: ...shown in the table below Tab Name Contents Status Specify the processor mode Emulation Memory Specify the emulation memory area To keep the Emem dialog box closed next time the debugger is started ch...

Page 65: ...Expansion Mode Microprocessor Microprocessor Mode 5 3 1 1 2 Inspecting the MCU status Clicking this tab displays the status of each MCU pin It allows to check whether the MCU pin status matches the pr...

Page 66: ...indow s disassemble display mode may not be correct The following bank addresses cannot be specified MCU internal resources e g SFR and RAM areas DRAM area and multiplexed area Interrupt vector area 5...

Page 67: ...that the debug areas will not overlap Make sure the total size of the specified debug target areas does not exceed the emulation memory size of the emulation pod used The size of emulation memory tha...

Page 68: ...essor Mode Note The emulator temporarily uses the area from FFCh to FFFFh as a stack Set this area as Internal If you want to set this area to External be sure to prepare read write unprotected memory...

Page 69: ...allocated for an external area set that area for External The memory map attributes immediately after the emulator has started up are External for 0h 3FFFh and Internal for 4000h FFFFh Use the MAP co...

Page 70: ...0 M16C 61 group M30600 M16C 62 group M30620B M16C 20 series M30620B There is a case that the emulation pod need the different firmware from the listed firmware when the emulation pod is re modeled 2 S...

Page 71: ...0 the allowable designation range is a 0 page address range 0h to FFh For a microcomputer which sets the stack page selection bit initial value to 1 the allowable designation range is a 1 page addres...

Page 72: ...ATTENTION For a new MCU new POD number new firmware name and new MCU information number may be used 5 6 2 1 Example 2 3B FF FFFC 0 M38000 00 58...

Page 73: ...Tutorial 59...

Page 74: ...Blank Page 60...

Page 75: ...unction generates random data to be sorted The sort function sorts the generated random data in ascending order The change function then sorts the data in descending order Note After recompilation the...

Page 76: ...d connect the emulator refer to 4 Preparation before Use 6 2 1 2 Setup the Debugger If it connects with an emulator the dialog box for setting up a debugger will be displayed Please set up the debugge...

Page 77: ...e Operation of RAM Select Memory from the CPU submenu of the View menu and enter the RAM address Here enter 400 in the Display Address edit boxes The Scroll Start Address and Scroll End Address editin...

Page 78: ...replace the screen image and addresses with corresponding one to your target mcu The Debugger for M16C R8C or M32C Select Download module from Tutorial x30 under Download modules The Debugger for 740...

Page 79: ...e A Editor Source window opens and the contents of a Tutorial c file are displayed Select the Format Views option from the Setup menu to set a font and size that are legible if necessary Initially the...

Page 80: ...breakpoint at any point in a program 6 2 4 1 Setting a Software Breakpoint For example to set a software breakpoint at the sort function call Double click the S W breakpoints column on the line contai...

Page 81: ...the Program To execute the program select Go from the Debug menu or click the Go button on the toolbar The program will be executed up to the breakpoint that has been set and an arrow will be displaye...

Page 82: ...e of the break that occurred last time in the Status window Select Status from the CPU submenu of the View menu After the Status window is displayed open the Platform sheet and check the Status of Cau...

Page 83: ...ser can see all the breakpoints set in the program in the Breakpoints dialog box 6 2 6 1 Reviewing Breakpoints Push the key Ctrl B and the Breakpoints dialog box will be displayed This window allows t...

Page 84: ...ers from the CPU submenu of the View menu The Register window is displayed The figure below shows a Register window of the debugger for M16C R8C 6 2 7 2 Setting the Register Value You can change a reg...

Page 85: ...w the memory contents corresponding to __msize in word size Select ASM Watch from the Symbol submenu of the View menu open the ASM Watch window And click the ASM Watch window with the right hand mouse...

Page 86: ...watch window 6 2 9 1 Watching Variables For example set a watch on the long type array a declared at the beginning of the program by using the following procedure Click the left of displayed array a i...

Page 87: ...e C Watch window by specifying its name Click the C Watch window with the right hand mouse button and select Add from the popup menu The following dialog box will be displayed Enter variable i Click t...

Page 88: ...t called the function subroutine 3 Step Over Executes a function subroutine call in a single step 4 Step Steps the specified times repeatedly at a specified rate 6 2 10 1 Executing Step In Command The...

Page 89: ...e calling statement in the main function To step out of the sort function select Step Out from the Debug menu or click the Step Out button on the toolbar The PC cursor slips out of a sort function and...

Page 90: ...all as a single step and stops at the next statement of the main program To step through all statements in the change function at a single step select Step Over from the Debug menu or click the Step O...

Page 91: ...2 11 1 Forced Breaking of Program Executions Cancel all breaks To execute the remaining sections of the main function select Go from the Debug menu or the Go button on the toolbar The program goes in...

Page 92: ...ed Local tab All the local variables that can be referred to by the scope in which the the PC exists are displayed If a scope is changed by program execution the contents of the Local tab will also ch...

Page 93: ...le click the S W Breakpoints column in the sort function and set a software breakpoint To executes the user program from the reset vector address select Reset Go from the Debug menu or click the Reset...

Page 94: ...er Sophisticated debugging can be carried out by using the emulation functions that the emulator offers This provides for effective investigation of hardware and software problems by accurately isolat...

Page 95: ...Reference 81...

Page 96: ...Blank Page 82...

Page 97: ...s Time Measurement Window View Trace Time Measure Trace Window View Trace Trace Data Trace Window View Trace Data Trace GUI I O Wind w o View Graphic GUI I O MR Window View RTOS MR MR Trace Window Vie...

Page 98: ...range Refer to 7 1 2 Setting the RAM monitor area for details on how to change the RAM monitor area The default RAM monitor area is mapped into a 1 Kbyte area beginning with the start address of the i...

Page 99: ...cess attributes in byte units If bytes in one data have a different access attribute as in this case those data are enclosed in parentheses when displayed in the window In that case the background col...

Page 100: ...ata Length 8bytes Display in 8Byte unit Hex Display in Hexadecimal Dec Display in Decimal Single Dec Display in Signed Decimal Oct Display in Octdecimal Radix Bin Display in Binary ASCII Display as AS...

Page 101: ...this dialog box to change the position of the RAM monitor area Specify the RAM monitor area by its start address The size cannot be changed fixed to 1 Kbyte The start address can be specified in 0x10...

Page 102: ...re specified for the watchpoints the watchpoint addresses are recalculated when downloading the target program The invalid watchpoints are marked by not active when displayed on the screen The order i...

Page 103: ...cted watchpoint Bin Display in Binary Dec Display in Decimal Radix Hex Display in Hexadecimal Refresh Refresh memory data Address Area Switch display or non display of Address area Layout Size Area Sw...

Page 104: ...r each variable individually The initial display radix can be changed Leading zero suppression is selectable in hexadecimal display Any variable can be registered to the Watch tab so that it will be d...

Page 105: ...ved The contents of the Watch tab and those of newly added tabs are saved The RAM monitor obtains the data accessed through the bus Any change other than the access from the target program will not be...

Page 106: ...display char type as a string Zero suppress in Hex display Suppress zero in Hex display Sort by Name Sort variables by its name Sort Sort by Address Sort variables by its address Enable RAM Monitor S...

Page 107: ...itor window in which you can check execution non execution by source line The coverage measurement area is an any 256 KB area starting from the 64 KB boundary The top address of the coverage measureme...

Page 108: ...rage measurement result Clear Clear coverage measurement result Base Change coverage base address Save Save coverage measurement result to file File Load Load coverage measurement result from file Lay...

Page 109: ...Coverage check box in the dialog box opened by choosing the main menu Edit Define Column Format The column for a coverage measurement display is displayed on all Editor Source windows And select popup...

Page 110: ...w file without specifying a log file When a script file is opened the command history area changes to become the script file display area and displays the contents of the script file When script files...

Page 111: ...pen log file and start recording start output to file Log Off Close log file and end recording stop output to file On Record the executed commands to a file Record Off Stop recording the executed comm...

Page 112: ...ntinue to set software breakpoints until you click the Close button to close the S W Break Point Setting Window You can clear enable or disable software breakpoints selected by clicking in the softwar...

Page 113: ...le Help Display the help of this window Add Add the break point Refer Open file selection dialog box Close Close the window Delete Remove the selected break point Delete All Remove all break points En...

Page 114: ...A red marker is displayed on the line to which the break point was set You can delete the break point by double clicking again in the break point setting area S W breakpoints column In the Editor Sour...

Page 115: ...type Read The debugger for M16C R8C Fetch Memory Access Bit Access Interrupt External Trigger The debugger for 740 Fetch Memory Access Bit Access Interrupt External Trigger Events at up to six points...

Page 116: ...t events double click to select the event you want to set from the event setting area of the H W Break Point Setting Window This opens the dialog box shown below Following events can be set by specify...

Page 117: ...ialogs When FETCH is selected Breaks for the instruction fetch The debugger for M32C not support When using these products use memory access instead When DATA ACCESS is selected Breaks for the memory...

Page 118: ...When BIT SYMBOL is selected Breaks for the bit access When INTERRUPT is selected Breaks for the interrupt occurrence or termination The debugger for M32C not support 104...

Page 119: ...7 Windows Dialogs When TRIGGER is selected Breaks for the status of signal input from external trace cable 105...

Page 120: ...k the pass count value of that event When AND Same Time is selected In the event specification area the event used can be specified No pass counts can be specified When State Transition is selected Cl...

Page 121: ...he realtime OS 7 7 4 Command Button The buttons on this window has the following meanings Button Function Reset Discards the contents being displayed in the window and loads contents from the emulator...

Page 122: ...e the event select dialog box s Event Type to FETCH The event is established when instruction is fetched from the specified address or any address in the specified address range 7 7 5 1 Instruction Fe...

Page 123: ...7 Windows Dialogs 7 7 5 2 Instruction Fetch of Specified Address Area In Set as below Example Instruction fetch at address 80000h to 80FFFh 109...

Page 124: ...7 7 5 3 Instruction Fetch of Specified Address Area Out Set as below Example Instruction fetch at any address other than the range 80000h to 80FFFh 110...

Page 125: ...7 Windows Dialogs 7 7 5 4 Entering exiting to specified function Set as below Example Entering a break to function name wait Example Exiting from function name wait 111...

Page 126: ...og box s Event Type to DATA ACCESS The event is established when memory is accessed at the specified address or under conditions set for the specified address range 7 7 6 1 Memory Access The debugger...

Page 127: ...7 Windows Dialogs 7 7 6 1 1 Writing Reading a Specified Address Set as below Example Writing to even address 400h 113...

Page 128: ...Example Writing byte length data 32h to even address 400h 114...

Page 129: ...7 Windows Dialogs Example Writing byte length data 32h to odd address 401h Contents of settings vary with each product and bus width 8 bits bus width 115...

Page 130: ...16 bits bus width 116...

Page 131: ...e Writing word length data 1234h to even address 400h Contents of settings vary with each product and bus width 8 bits bus width Please specify And of the 1st point and the 2nd point for a combination...

Page 132: ...2nd point 118...

Page 133: ...7 Windows Dialogs 16 bits bus width 119...

Page 134: ...Example Writing data 10h 3Fh to even address 400h 120...

Page 135: ...7 Windows Dialogs 7 7 6 1 2 Reading writing data to the specified address range Set as below Example Writing data to addresses ranging from 400h to 40Fh 121...

Page 136: ...7 7 6 1 3 Reading writing data to addresses outside the specified range Set as below Example Writing data to addresses below 7FFh 122...

Page 137: ...7 Windows Dialogs 7 7 6 2 Memory Access The debugger for M16C R8C 7 7 6 2 1 Writing Reading a Specified Address Set as below Example Writing to even address 400h 123...

Page 138: ...Example Writing byte length data 32h to even address 400h 124...

Page 139: ...7 Windows Dialogs Example Writing byte length data 32h to odd address 401h Contents of settings vary with each product and bus width 8 bits bus width 125...

Page 140: ...16 bits bus width 126...

Page 141: ...7 Windows Dialogs Example Writing word length data 1234h to even address 400h 127...

Page 142: ...Example Writing data 10h 3Fh to even address 400h 128...

Page 143: ...7 Windows Dialogs 7 7 6 2 2 Reading writing data to the specified address range Set as below Example Writing data to addresses ranging from 400h to 40Fh 129...

Page 144: ...7 7 6 2 3 Reading writing data to addresses outside the specified range Set as below Example Writing data to addresses below 7FFh 130...

Page 145: ...mory Access The debugger for 740 The debugger For 740 a write of word length data to the even address cannot be detected either 7 7 6 3 1 Writing Reading a Specified Address Set as below Example Writi...

Page 146: ...Example Writing byte length data 32h to even address 400h 132...

Page 147: ...7 Windows Dialogs Example Writing data 10h 3Fh to even address 400h 133...

Page 148: ...7 7 6 3 2 Reading writing data to the specified address range Set as below Example Writing data to addresses ranging from 400h to 40Fh 134...

Page 149: ...7 Windows Dialogs 7 7 6 3 3 Reading writing data to addresses outside the specified range Set as below Example Writing data to addresses below 7FFh 135...

Page 150: ...select dialog box s Event Type to BIT SYMBOL The event is established when the specified bit at the specified address or specified bit symbol is accessed under specified conditions 7 7 7 1 Writing Re...

Page 151: ...7 Windows Dialogs 7 7 7 1 1 Writing Reading a Specified Bit Symbol Set as below Example Writing 1 to bit symbol bitsym 137...

Page 152: ...ents Interrupt To specify an interrupt event change Event Type in the event select dialog box to INTERRUPT When an interrupt is generated or finished the event is established 7 7 8 1 Interrupt Occurre...

Page 153: ...7 Windows Dialogs 7 7 8 2 Interrupt Termination Set as below 139...

Page 154: ...on the external trace signal input cable included with the emulator A combination of eight signals is possible The following shows the names of signals from the external trace signal input cable and...

Page 155: ...7 Windows Dialogs Example Fall of EXT1 brown signal 7 7 9 2 Combination of rise fall edges Set as below Example Rise of EXT0 white EXT7 purple signal fall of EXT1 brown signal 141...

Page 156: ...SITION Established upon entering a break state in the state transition diagram Pass counts number of times passed can be specified for each event 1 255 If the specified combinatorial condition is AND...

Page 157: ...agram or sequentially A state time out time can also be specified Specification by a state transition diagram Use the state transition diagram of the State Transition group Click any button here to se...

Page 158: ...Sequential group Pass counts can be specified from the popup menu that appears when selecting an event The contents set here are reflected in the state transition diagram Example Events A1 A2 and A3 t...

Page 159: ...right of it is enabled Click the Detail button included in the PID group This opens the Process ID Setting dialog box In the PID Setting area specify the memory address in which to store the execution...

Page 160: ...ods to set protect break Specify from the target program session information Specify the memory attribute of the desired address range 7 8 1 Extended Menus This window has the following popup menus th...

Page 161: ...by memory access Access type Read The debugger for M16C R8C Fetch Memory Access Bit Access Interrupt Trigger The debugger for 740 Fetch Memory Access Bit Access Interrupt Trigger Events at up to six p...

Page 162: ...nt setting area of the Trace Point Setting Window This opens the dialog box shown below Following events can be set by specifying Event Type in this dialog box When FETCH is selected Traces for the in...

Page 163: ...7 Windows Dialogs When DATA ACCESS is selected Traces for the memory access When BIT SYMBOL is selected Traces for the bit access 149...

Page 164: ...en INTERRUPT is selected Traces for the interrupt occurrence or termination The debugger for M32C not support When TRIGGER is selected Traces for the status of signal input from external trace cable 1...

Page 165: ...ion area When AND or OR is selected In the event specification area the event used and a pass count for that event can be specified To lter the pass count while the event to alter is being selected cl...

Page 166: ...nly event establishment under specific conditions Example Enable only the event that occurs in a specific task when using the realtime OS 7 9 4 Specify the Trace Range For the PC4701 emulator debugger...

Page 167: ...hed Cycles from where specified event is established to where specified event is not established Cycles from where start event is established to where end event is established 7 9 6 Command Button The...

Page 168: ...ecify the Events Interrupt How to set events for bit access is same as the way for H W Break Point Setting Window For detail about the setting refer to 7 7 8 Specify the Events Interrupt 7 9 11 Specif...

Page 169: ...e start event unestablished 5 Other than cycles from the start event established to the end event established 6 Other than cycles where the start event is established 7 Other than cycles from the star...

Page 170: ...For condition 3 choose the Mode shown below and set the Start event For condition 4 choose the Mode shown below and set the Start event 156...

Page 171: ...5 to 7 choose Exclude and click the Detail button to open the Realtime trace Write Condition dialog box For condition 5 choose the Mode shown below and set the Start and End events For condition 6 ch...

Page 172: ...For condition 7 choose the Mode shown below and set the Start event 158...

Page 173: ...ntents of events are altered they are marked by an asterisk on the title bar The asterisks are not displayed after setting up the emulator ATTENTION The Trace Point Setting Window and the Time Measure...

Page 174: ...s type Read The debugger for M16C R8C Fetch Memory Access Bit Access Interrupt External Trigger The debugger for 740 Fetch Memory Access Bit Access Interrupt External Trigger To set events double clic...

Page 175: ...logs When FETCH is selected Measures for the instruction fetch The debugger for M32C not support When using these products use memory access instead When DATA ACCESS is selected Measures for the memor...

Page 176: ...When BIT SYMBOL is selected Measures for the bit access When INTERRUPT is selected Measures for the interrupt occurrence or termination The debugger for M32C not support 162...

Page 177: ...7 Windows Dialogs When TRIGGER is selected Measures for the status of signal input from external trace cable 163...

Page 178: ...ult includes the execution time of other functions that have been called from within the specified function Measures the execution time of functions The start address and the end address of the functi...

Page 179: ...y Access 7 10 6 Specify the Events Bit Access How to set events for bit access is same as the way for H W Break Point Setting Window For detail about the setting refer to 7 7 7 Specify the Events Bit...

Page 180: ...le to measure the execution time of that function Up to four measurement intervals can be specified To specify measurement intervals click any line MP1 MP4 in the Measurement Point group of the Interv...

Page 181: ...vent measurement start event only 2 Specify the following in the Measurement Condition Designation dialog 7 10 9 3 Measure the event establishment time 1 Set the measurement event measurement start ev...

Page 182: ...de the function top address is automatically registered to the measurement start event and the function end address to the measurement end address The measurement result contains the execution time of...

Page 183: ...tart event The measurement result does not contain the execution time of other function called within the specified function Specify the following in the Measurement Condition Designation dialog ATTEN...

Page 184: ...e cycles In addition to data access information this mode allows source line information to be displayed in combination Source mode This mode allows you to inspect the program execution path in the so...

Page 185: ...ram started running up to now in terms of absolute time default Differences Shows a differential time from the immediately preceding cycle Relative Time Shows a relative time from the selected cycle N...

Page 186: ...earch for addresses 2 Object code display area Shows the object codes of instructions 3 Label display area Shows labels corresponding to instruction addresses Double click here to bring up a dialog bo...

Page 187: ...s shown below 1 Data access display area Shows data access information If the information displayed here is 000400 1234 W for example it means that data 1234H was written to the address 000400H in 2 b...

Page 188: ...alog box to search for addresses 3 Referenced cycle display area Shows the currently referenced cycle that is marked by Furthermore the addresses corresponding to source lines if any are marked by 4 S...

Page 189: ...erences Shows a differential time from the immediately preceding displayed cycle Time Relative Time Shows a relative time from the currently selected cycle Forward Changes the direction of search to f...

Page 190: ...ad access words ML on INT Interrupt acknowledge RB Read access bytes WB Write access bytes DRB Read access by DMA bytes DWB Write access by DMA bytes RW Read access words WW Write access words DRW Rea...

Page 191: ...3 1 3bytes 1byte DMA DMA accessing DMAT DMA accessing terminal count B T Shows the level of the external break trigger the EXTIN7 pin of the external trace signal input cable High level 1 Low level 0...

Page 192: ...Display format Status No change DMA Data access other than a C U cause such as DMA P INT Start of INTACK sequence IB Instruction code read due to CPU cau e bytes s DB Data access due to CPU cause byte...

Page 193: ...4 B T Shows the level of the external break trigger the EXTIN7 pin of the external trace signal input cable High level 1 Low level 0 Q T Shows the level of the external trace trigger the EXTIN6 pin o...

Page 194: ...direct ion of the data bus When data is to be read this signal indicates a logic 0 Write This signal determines the direct ion of the data bus When data is to be written this signal indicates a logic...

Page 195: ...nspect memory values at the point of a cycle currently in interest or the values of registered C variables In the access history reference area you can see the history of accesses to registered addres...

Page 196: ...pe Name Hide type names from variables Add Adds new watch item into Access History Reference Area Remove Removes the selected watch item from Access History Reference Area Zoom In Increase the display...

Page 197: ...ng Displays erases a character string specified by the user when any value is written to the specified address bit LED Changes the display color of any area when any value is written to the specified...

Page 198: ...ste the copied I O item Create Button Create a new button item Create Label Create a new label item Create LED Create a new LED item Create Text Create a new text item Display grid Display the grid li...

Page 199: ...MR window display mode changes and the display data also changes By double clicking the desired task line you can display the context data of the task You can drag the cursor to change the width of t...

Page 200: ...ler status Alarm Handler Displays Alarm Handler status Memory Pool Displays Memory Pool status Message Buffer Displays Message Buffer status Port Displays Port status Mode Mailbox with Priority Displa...

Page 201: ...he Task Status When the realtime OS is MRxx conformed to uITRON specifications V 3 0 All the tasks defined in the configuration are listed in the order of ID number The function of each item is as des...

Page 202: ...suspended WAI SEM TMO Waiting state for a semaphore resource with time out WAI SEM TMO SUS Waiting state for a semaphore resource with time out suspended WAI MBX Receiving waiting state for a mailbox...

Page 203: ...ted in the order of ID number The function of each item is as described below When the realtime OS is MRxx conformed to uITRON specifications V 4 0 Items Contents ID Task ID Name Task name Pri Priorit...

Page 204: ...r a data queue suspended WAI SDTQ TMO Sending waiting state for a data queue with time out WAI SDTQ TMO SUS Sending waiting state for a data queue with time out suspended WAI RDTQ Receiving waiting st...

Page 205: ...nformed to uITRON specifications V 3 0 Item Contents Pri Displays priority RdyQ Shows the ID Nos and task names of tasks in the ready queue Up to 8 characters of the task name is displayed in the RdyQ...

Page 206: ...Contents Value Shows the timeout value of each task ID name Shows the ID No and task name of the tasks in the timeout queue Following character strings are used to indicate the type of wait state Char...

Page 207: ...sks in the timeout queue Following character strings are used to indicate the type of wait state Character string Wait state slp Wait due to tslp_tsk dly Wait due to dly_tsk flg Wait due to twai_flg s...

Page 208: ...g Q field When a task connected to the event flag queue is in the state of forced waiting double waiting a string s which indicates double waiting is appended to a string displayed in the flag Q field...

Page 209: ...ueue is in the state of waiting with timeout enabled waiting in twai_flg a string tmo which indicates a state of waiting with timeout enabled is appended to a string displayed in the Flag Queue field...

Page 210: ...displayed in the semQ field When a task connected to the SEM queue is in the state of forced waiting double waiting a string s which indicates double waiting is appended to a string displayed in the s...

Page 211: ...is appended to a string displayed in the Semaphore Queue field When a task connected to the SEM queue is in the state of forced waiting double waiting a string s which indicates double waiting is app...

Page 212: ...displays the stored message When no message is stored when Msg_cont is zero the WaitQueue field displays a string Task if a task waiting for a message exists and then displays the ID number and name...

Page 213: ...k priority order TA_MFIFO Message queue is in FIFO order TA_MPRI Message queue is in message priority order When a task connected to the mail box queue is in the state of waiting with timeout enabled...

Page 214: ...e Wait ID No and task name of tasks waiting for message transmission waiting or message reception waiting Data Queue Data The messages stored in the data queue The display of the ID field varies depen...

Page 215: ...timeout enabled a string tmo which indicates the state of timeout enabled is appended to a string displayed in the Data Queue Wait field When a task connected to the data queue is in the state of for...

Page 216: ...listed in the order of ID number The function of each item is listed below When the realtime OS is MRxx conformed to uITRON specifications V 3 0 Item Contents ID ID No of cycle handler StaAddr Starti...

Page 217: ...med to uITRON specifications V 4 0 Item Contents ID ID No of cycle handler Name Name of cycle handler Cycphs The activation phase by the millisecond Cyctim The activation cycle time by the millisecond...

Page 218: ...Starting address of alarm handler name Name of alarm handler AlarmTime Starting time of alarm handler 7 14 10 2 Display the Alarm Handler Status When the realtime OS is MRxx conformed to uITRON speci...

Page 219: ...cks and information on unused memory blocks bit information The display of the ID field varies depending on which one is specified fixed length or optional length If the data is of fixed length the ID...

Page 220: ...on unused memory blocks Memory Pool Queue Displays the ID number and name of tasks waiting in the memory pool The following are displayed in the Mplatr area TA_TFIFO Task wait queue is in FIFO order...

Page 221: ...ng the data display area in the task state display mode Enter the task ID number in the Task ID field and click the View button or press the Enter key The context of the specified task appears in the...

Page 222: ...ntext dialog is used to set the specified context register value of the specified task Specify the register to be changed in the Register field list box and enter the value to be set in the Value fiel...

Page 223: ...y when a target program which uses our real time OS MRxx is downloaded For MR30 For MR30 this window is available for V 2 00 or later version If a target program crated on MR30 V 1 00 is downloaded th...

Page 224: ...time at which the start marker is positioned as 0 with the left forward in time set to minus and the right backward in time set to plus The grid lines allow you to roughly understand the interrupt occ...

Page 225: ...ker to full width of display area Adjust Expand Expand scale factor of display Reduce Reduce scale factor of display Trace Stop Stop measuring Trace Restart Restarts measuring Search Search for histor...

Page 226: ...r Stores the cycles of trace data after the trace point Break Stores the cycles to the point at which the trace point is passed Execute the target program Record the information required to know the t...

Page 227: ...e task execution transition in the MR Trace window By moving the mouse to any information displayed in the window the following window is opened showing the detailed information Interrupt handling or...

Page 228: ...search direction The debugger searches the items in the direction specified in the dialog using the position pointed by the indicator as the radix point When the debugger does not check all the searc...

Page 229: ...adix point By default the display is expanded or reduced with display scale of 1 5 The display scale appears in the Scale field in the status bar The default expansion reduction scale is 1 5 To change...

Page 230: ...2 4 5 Display the specific task only Click the task interrupt routine to be hidden the left portion of the graph Every time you click the setting is switched between Display and Hide 7 15 2 4 6 Chang...

Page 231: ...is specified in the Value dialog which has nothing to do with the time value It is provided so that you can see the window easily 7 15 2 5 1 Move the Marker Each marker can be moved by dragging When m...

Page 232: ...gether with the MR Trace window This window is available only when a target program using our real time OS MRxx is downloaded 7 16 1 Configuration of CPU Occupancy Status Display Mode The CPU occupati...

Page 233: ...um ready time of the task corresponding to the clicked line The search result is pointed by the indicator which moves to the target position in the MR Trace window 7 16 3 Configuration of System Call...

Page 234: ...ndow does not show any data the MR Analyze window will not function The execution history statistical processing function allows you to reference the following topics 7 16 5 1 1 Refer the CPU Occupati...

Page 235: ...ady time of the task corresponding to the clicked line The search result is pointed by the indicator in the MR Trace window after the indicator moves to the destination position 7 16 5 3 Refer the Sys...

Page 236: ...in the tool bar Or select Menu Pick Up System Call The dialog shown below is opened Specify the search condition of the system call to be extracted and displayed Extract the issuance history of the sy...

Page 237: ...nt is displayed in the task source display area When performing Come pause specify the stop position using the cursor in this display area 7 17 1 About Task Pause Function The task pause function is t...

Page 238: ...tches the view to the source mode Mixed Switches the view to the mixed mode Mode Disassembly Switches the view to the disassembly mode Line Shows Hides the line number column Address Shows Hides the a...

Page 239: ...the Pause button is enabled Click the Pause button The task selected at this timing is paused This is enabled only when the selected task is in the execution state ATTENTION You can pause the target...

Page 240: ...ars in the status bar In the task source display area the program starting from the task start address is displayed if the program is in a state other than Pause 2 Click the line to be paused in the t...

Page 241: ...ted task is released from the PAUSE state temporarily The task is executed immediately before the cursor and then it gets paused again ATTENTION When executing Come pause be sure to specify the cursor...

Page 242: ...ause display area of the ask line to be released from the PAUSE state After the target task is selected the task ID number is displayed in the status bar The Unpause button is enabled if the task is p...

Page 243: ...ame field in the task pause display area of the ask line to be displayed If the target task is paused the task Pause position context PC position is displayed If the target task is in a state other th...

Page 244: ...icates an interrupt routine name task name idle processing display idle and unknown name displayed unknown When moving the mouse to the information displayed in the window the pop up window as below i...

Page 245: ...e Value dialog It has nothing to do with the time value This is provided so that you can see the window easily 7 18 1 Extended Menus This window has the following popup menus that can be brought up by...

Page 246: ...ore the Task Trace window is opened When using our real time OS MRxx 1 Click the default button The MRxx information is set 2 Click the OK button The Task Trace window is opened When using a real time...

Page 247: ...efore the target program stops Only an specific cycle required to know the task execution history is recorded in the trace memory ATTENTION A trace point set in the Trace Point Setting dialog is disab...

Page 248: ...utton in the tool bar Or select Expand or Reduce from popup menu by right clicking on the window The display is expanded or reduced using the left corner of the graph area as the radix point By defaul...

Page 249: ...The Value dialog is opened Specify the time interval in the display 7 18 2 2 3 Change the task display order Select Color from popup menu by right clicking on the window The Color dialog is opened Cl...

Page 250: ...ch sets the start marker to 0 the grid interval is specified in the Value dialog which has nothing to do with the time value It is provided so that you can see the window easily 7 18 2 3 1 Move the Ma...

Page 251: ...play mode is used to display the CPU occupation time and ratio by task This mode shows the statistical result within the range specified by the start marker and end marker in the Task Trace window By...

Page 252: ...not show any data the Task Analyze window will not function The displayed data is the statistical results of the range specified by the start marker and the end marker in the Task Trace window By clic...

Page 253: ...ts for user input until the specified time has elapsed StepInstruction SI Step execution of instructions OverStep O Overstep execution of source lines OverStepInstruaction OI Overstep execution of ins...

Page 254: ...emory blocks in 2 byte units 8 1 5 Assemble Disassemble Commands Command Name S ort Name h Contents Assemble A Line by line assembly DisAsse ble m DA Disassembles memory contents line by line Module M...

Page 255: ...1 10 Script Log File Commands Comm nd Name a Short Name Contents Script Opens and executes a script file Exit Exits the script file Wait Waits for an event to occur before command input Pause Waits fo...

Page 256: ...ntents Print Check value of specified C variable expression Set Set specified data in specified C variable expression 8 1 16 Real time OS Command Command Name Short Name Contents MR Displays status of...

Page 257: ...ays the contents of that file FillByte FB Fills a memory block with the specified data in 1 byte units FillLword FL Fills a memory block with the specified data in 4 byte units FillWord FW Fills a mem...

Page 258: ...Clears software breaks SoftwareBreakClearAll SBCA Clears software breaks SoftwareBreakDisable SBD Disables software breakpoints SoftwareBreakDisable ll A SBDA Disables all software breaks SoftwareBrea...

Page 259: ...Notes You cannot include comments on the same lines as script commands You can nest script files up to five levels You can nest if statements and while statements up to 32 levels If statements must b...

Page 260: ...n integer between 0h and FFFFFFFFh to be assigned in a macro variable If you specify a negative number it is processed as twos complement You can use macro variables within the expression Always prece...

Page 261: ...oop is exited and the statement following the endw statement is executed You can nest while statements up to 32 levels Use the break statement to forcibly exit a while loop If while statements are nes...

Page 262: ...x symbol attached to the numerical value indicates which radix is used The debugger for M32C and M16C R8C and 740 Hexadecimal Decimal Octal Binary Prefix 0x 0X None Suffix h H None o O b B Examples 0x...

Page 263: ...structured instructions pseudo instructions macro instructions operation code or reserved words SECTION BYTE switch if etc You cannot use strings that start with two periods for symbols or labels D0 t...

Page 264: ...ocal bit symbols outside scope 9 2 3 Macro Variables Macro variables are defined by assign statements in the script file See Section 9 1 2 Assign Statement in the Reference part for details Precede va...

Page 265: ...size You can specify expressions in addresses you can also specify memory variables The data size is specified as shown in the following table The debugger for 740 doesn t support four byte length dat...

Page 266: ...ue 4344h 9 2 8 Operators The table below lists the operators that you can use in expressions The priority of operators is indicated by the level level 1 being the highest and level 8 the lowest If two...

Page 267: ...r unsigned long Casting to typedef types DWORD ENUM Variable names and function names var i j func Character constants A b Character string literals abcdef I am a boy 10 1 1 Immediate Values You can u...

Page 268: ...he following shows the order of priority in which they are evaluated Notes There is no support currently for mathematical operators for floating point numbers 10 1 4 Pointers Pointers are indicated by...

Page 269: ...nly use variable_name member_name for checking the members of structures and unions using the dot operator Example class T public int member1 char member2 class T t_cls class T pt_cls t_cls In this ca...

Page 270: ...can use the and to specify the elements of an array You can code arrays as follows variable_name element_No or variable variable_name element_No or variable element_No or variable etc 10 1 12 Casting...

Page 271: ...10 1 16 Character Constants You can use characters enclosed in single quote marks as character constants For example A b etc These character constants are converted to ASCII code and used as 1 byte im...

Page 272: ...000000010000B when Radix is binary 10 2 2 Basic Types When the result of calculation is a basic type other than a char type or floating point type it is displayed as follows unsigned int i 65280 when...

Page 273: ...l Radices character types unsigned char str 0x1234 74 J all Radices l When the result of calculation is a char type it is displayed as follows unsigned char str 0x1234 Jap all Radices If the string co...

Page 274: ...refer 10 2 3 Pointer Types When the number of the array elements is more than 100 the following dialog box open Specify the number of the elements in the dialog box The elements from the index specifi...

Page 275: ...as in structures and unions the C C expression consists of members a is displayed to the left of the type name tag name You can double click on lines indicated by a to see the members of that structur...

Page 276: ...ak H W event Combination Hardware break logical combination AND or AND same time condition was met H W event Combination Ax Hardware break logical combination OR condition was met Ax The event number...

Page 277: ...hich can be set for software breakpoint varies depending on the type of MCU 12 1 2 1 The debugger for M32C The area which can be set for software breakpoint varies depending on the processor mode Proc...

Page 278: ...Literal character strings can only be substituted for char array and char pointer type variables No arithmetic operations can be performed on floating point types No sign inversion can be performed on...

Page 279: ...rm memory verify during download Not supported 12 1 6 Debugging multi modules If you register two or more absolute module file in one session you can download only one file in same time If you registe...

Page 280: ...indows XP is communicating with the LPT port the debugger is unable to communicate with the emulator Then this problem can be circumvented in either of the following methods however you need to take n...

Page 281: ...ch If system reset of the emulator does not function normally terminate the debugger turn ON the emulator again and restart the debugger Then re download the program 12 1 12 Debugging Resource on Emul...

Page 282: ...The information may not be downloaded debugged normally depending on the option designation of the compiler assembler and linker Please refer to the following for the option specification Refer to 12...

Page 283: ...ess 8000h Data 1234h Data Mask Don t care Even Address BYTE ex mov b 34h 8000h Address 8000h Data 34h Data Mask 00FFh Odd Address WORD ex mov w 1234h 8001h Not supported Odd Address BYTE ex mov b 34h...

Page 284: ...l read writable memory 12 3 2 Options for compiler assembler and linker The information may not be downloaded debugged normally depending on the option designation of the compiler assembler and linker...

Page 285: ...orted Odd Address BYTE ex mov b 34h 8001h Address 8001h Data 34h Data Mask 00FFh Address 8001h Data 3400h Data Mask FF00h 12 3 6 Operating frequency of MCU You need to specify the operating frequency...

Page 286: ...Memory Extension Mode Tab 12 3 9 Watch dog timer You can not debug the program using Watch dog timer While debugging please do not start WDT 12 3 10 CPU rewrite You can not debug the program using CP...

Page 287: ...the emulator The emulator uses the user stack area as a work area 3 bytes Before starting debugging be sure to reserve the user stack area 3 byte area 12 4 4 Specify the Clock When following Emulatio...

Page 288: ...d by breaking or single stepping during writing to the higher lower order byte of the 16 bit timer For example DATA1 TIMER_LOW DATA2 TIMER_HIGH when a break occurs here These problems caused by the mi...

Page 289: ...rocedures and link At assemble c option outputs debugging information concerned with source line to a relocatable file Note When the directive comand FUNC is specified to a function in a source file i...

Page 290: ...In the Format area check the Other option and select the ieee 695 as Output Format Include Tab In the XCL File Name area specify your XCL file ex lnkm16c xcl 2 Edit the XCL file Add the command line o...

Page 291: ...ption definition file name using f option We do not evaluate other settings so we can not recommend to append other options 12 5 4 2 Command Execution Examples The following shows examples of entering...

Page 292: ...e M16C Linker Locator Options Project Name dialog opens Please set as follows by this dialog Format Tab Please specify IEEE 695 for debuggers abs by Output Format 3 Build your program after the settin...

Page 293: ...ect setting Output Tab In the Format area check the Other option and select the elf dwarf as Output Format Include Tab In the XCL File Name area specify your XCL file ex lnkm32cf xcl 2 Edit the XCL fi...

Page 294: ...MEMO 280...

Page 295: ...n Date Jul 01 2007 Rev 1 00 Published by Sales Strategic Planning Div Renesas Technology Corp Edited by Microcomputer Tool Development Department Renesas Solutions Corp 2007 Renesas Technology Corp an...

Page 296: ...1753 Shimonumabe Nakahara ku Kawasaki shi Kanagawa 211 8668 Japan M16C PC4701 Emulator Debugger V 1 03 REJ10J1608 0100 User s Manual...

Reviews: