4. Description of the RPCM Device
Figure 4.2.13. Dashboard in View Mode RPCM DC 232A.
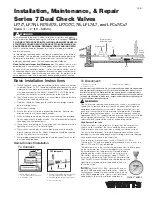
Figure 4.2.14. Dashboard in Control Mode RPCM DC 232A.
4.2.14. Showing Current Limits on graphs
By default current/voltage values scales in web-interface’s graphs are getting automatically ad-
justed to the maximum values appeared during the time interval shown on the graph.
Sometimes to evaluate actual usage of current flowing through the RPCM as well as voltage on
different channels you might want to see current consumption of several outlets as well as volt-
age of both inlets in the same scale based on maximum set limits.
To achieve this use the button to activate showing of Limits on the Top Control Bar and turn on
limit switches for inlets and outlets of interest.
46