33
After you finished working with hyperbola, press
Point info
button and the
theoretical hyperbola will disappear.
Zoom in
– selected area magnification. To select magnification area, press and
hold the left mouse button and select required zooming area. After releasing mouse
button selected area will extend to a size of the window. You can also zoom in using
your mouse wheel, simply scroll up the mouse wheel (while in
Zoom in
mode) and you
will extend the area around the mouse cursor’s position.
Zoom out –
Reverse action of
Zoom in
. You can also zoom out using your mouse
wheel, simply scroll down the mouse wheel (while in
Zoom out
mode).
Note: you can always (no matter the instrument you are currently using) Zoom in or
Zoom out by scrolling up or down the mouse wheel while holding Ctrl key on your
keyboard!
Scaled output
– scaling profile one to one, depending on the selected dimensions
of the vertical scale (samples to traces or depth to distance).
Fit profile
– Fits whole profile to the window size.
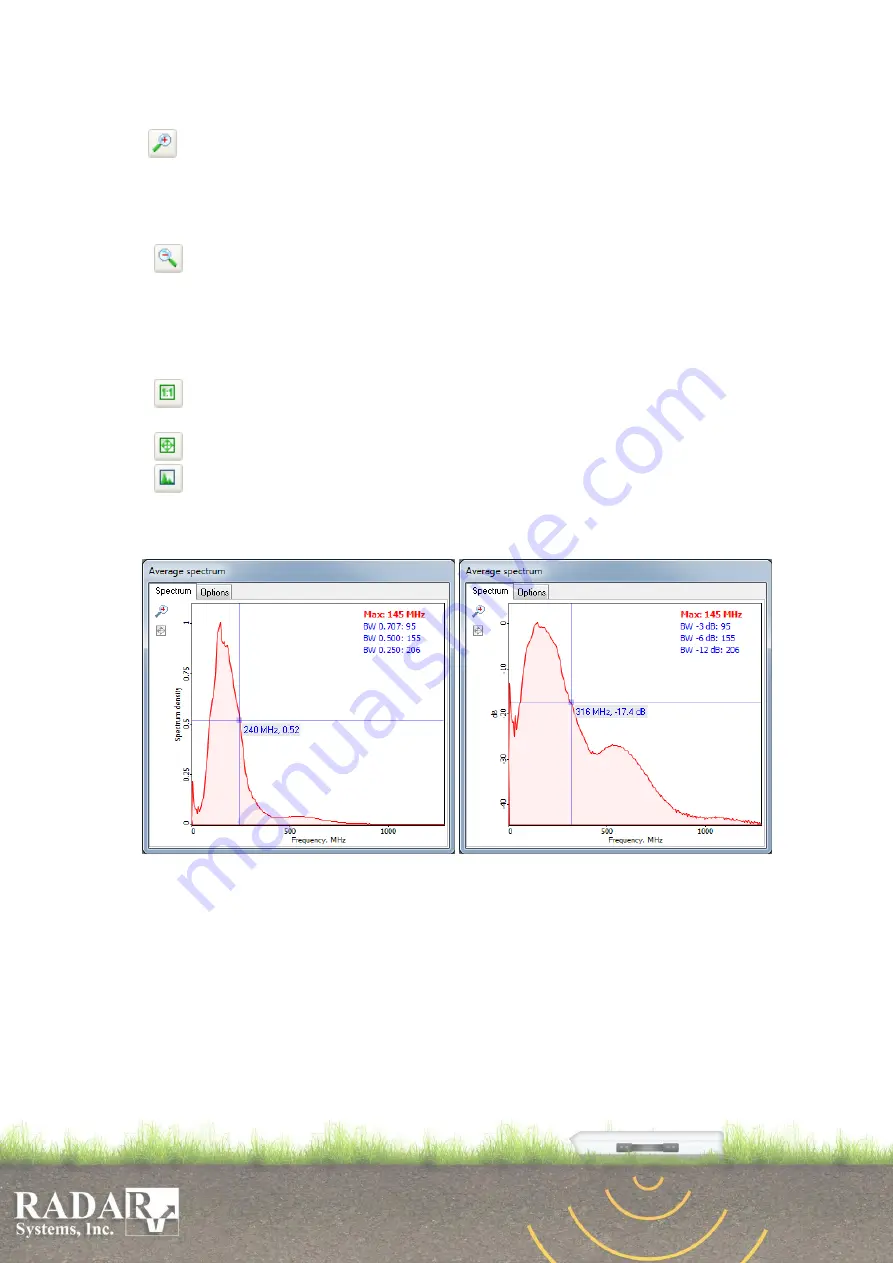
Average spectrum –
module of average spectrum calculation of selected area.
Used for signal spectral characteristics and interference analysis when choosing
bandwidth and suppression frequencies filters: Ormsby bandpass and Notch filter.
Fig.10.4. Spectrum Output dialog box with different amplitude scale units (in times/ in dB).
There are different options for Spectrum calculation and drawing on tab
Options
or
Tools/Mouse
action
/
Average spectrum
menu item. User can choose the source of
spectrum calculation (Raw or Processed data), scale units (times/dB) and color palette
(spectrum, indication and background colors). To select the calculation area, press and
hold left mouse button and select a rectangular area you need. After releasing mouse
button
Average Spectrum
dialogue box will appear (Fig. 10.4). To get precise
spectrum frequency and density values of a frequency axis point move the cursor to the
required point and press the left mouse button. Two lines intersected at a given point
will appear as well as the spectrum frequency and density values (Fig. 10.4). User could
find a toolbox with
Zoom in
and
Fit
spectrum to window size tools on the left side of


