29
10. Radiolocation Sounding Data File Handling
When one ore more profiles have been created in the course of sounding, various
operations may be made thereon, as described below.
Load a sounding data file, and have it displayed on the screen by using option
File/Open
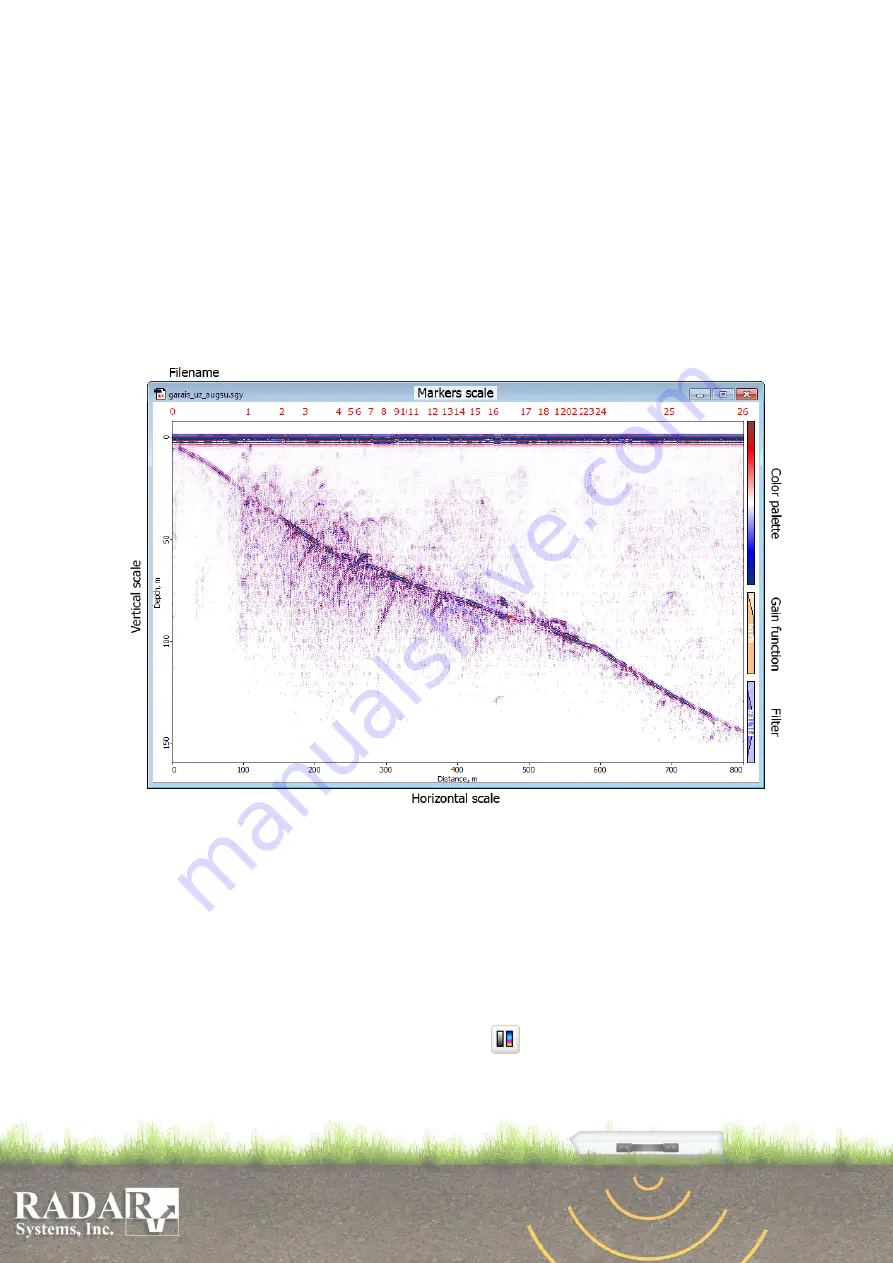
. By default, the application will display data as a line scan profile (Fig. 10.1) in
a separate window with standard Windows attributes in the right upper corner. The file
name will be shown in the left-hand upper corner. The window may be drawn across the
screen, and its size modified, using standard Windows means and ways. The number of
profiles to be displayed in the screen shall be unlimited. By default, they will be arranged
in a cascaded pattern; you may also choose their layout patterns at your discretion in option
Window
of the Main menu (see Subsection 7.6).
Fig. 10.1. Profile Output working window.
A radiolocation profile is provided with horizontal and vertical scales, vertical scale
can be moved for zero point adjustment (see Subsection 3.4). To set a zero point, draw the
cursor at the white field to the left of the profile (the cursor will take the form of a double
arrow), now when you press and hold the left mouse button move your mouse up and
down to move the scale so that the zero point coincides with the mid-point in the second
line of the sounding signal, as shown in Figs. 4.2 and 4.3. To the right of the profile, there
are three vertical columns used for quick tuning of the displayed profile. The upper column
is intended to change the color palette of displaying the radiolocation profile; this column
duplicates
Tools/Color palette
menu option and
button (brief color palette changing
menu appears when cursor holds under color palette column). Color palette modification
is described below; professionals however use black-and-white imaging that we also
recommend you to use, especially at the beginning.


