background image

QuantAsylum QA401 User

’s

 Manual 


Page 

58


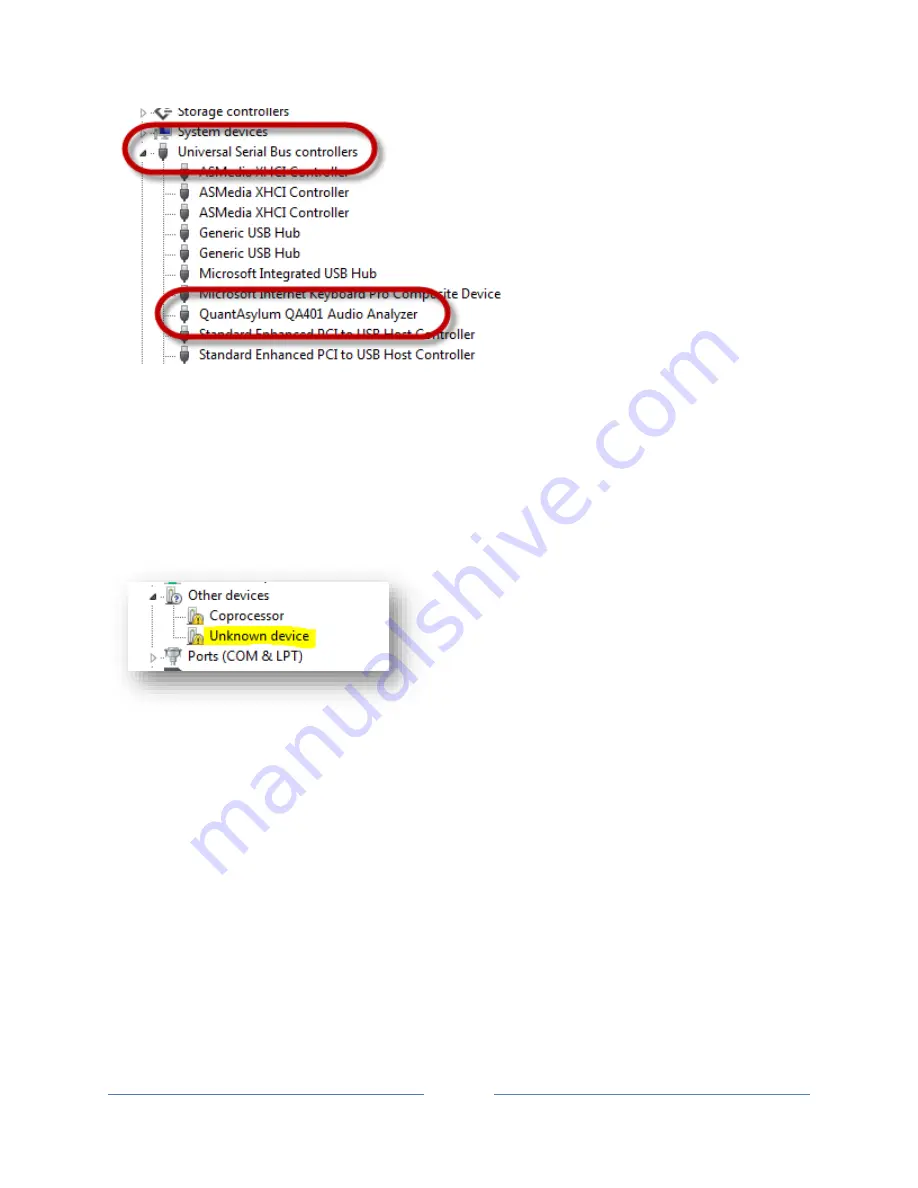
If you see something similar to the above, then the drivers has installed correctly. At this point, you can 
move to Step #3. 

If the driver has not installed, then you might have heard some tones indicating there was an issue, or a 
message might have popped up explaining the problem. 

You should see the device listed in the “other devices” section in the device manager. In this case, right 
click on the “unkown device” and verify that this in fact the expected device by inspecting the USB ID.


Summary of Contents for QA401

Page 1: ...QuantAsylum QA401 User s Manual Page 1 QuantAsylum QA401 User s Manual 192Ksps 24 bit Stereo Audio Analyzer Revision 1 704 January 2019...

Page 2: ...occurs under normal operating conditions will be replaced or repaired for free not including shipping Generally you will be responsible for shipping to us and we will be responsible for shipping it ba...

Page 3: ...cks and Pops 6 QA401 Analyzer Features 7 Analyzer Front Panel 7 Front Panel Summary 7 LEDs 8 BNC Inputs 8 Understanding Differential Measurements 8 Rear Panel Summary 9 Electrical Characteristics of t...

Page 4: ...d Context Menu 22 X Lin X Log Buttons and Context Menus 23 Display Panning and Scrolling 25 Titles and Markers 25 Adding Markers 26 Tracking Markers 28 Acquisition Control 28 Weighting 29 Windowing Fu...

Page 5: ...uts 56 Troubleshooting 56 Connectivity Issues 56 Appendix I Test Plugins 61 Appendix 2 Visualizers 63 Background 63 Appendix 3 Software API 65 Overview 65 Appendix 4 Regulatory Notice 68 Overview Safe...

Page 6: ...The audio inputs and outputs however are isolated from the PC This isolation is limited to 50V Do not connect the QA401 to a product that has its ground reference more than 50V from the PC ground BNC...

Page 7: ...ge modern ADC and DAC codecs commonly used for audio analysis while at the same time eliminating some of the bigger problems that come with re purposing audio ADCs for audio measurement The QA401 Feat...

Page 8: ...ended then you could use a BNC terminator on the L input and treat the L input as a single ended input If you do not use the input terminator then you will see some thermal noise from the unused inpu...

Page 9: ...l impedance of 100K ohms The corner frequency of this input network is about 1 6 Hz The input DC blocking capacitor is polarized with a 50V rating The DC blocking capacitor can withstand a negative vo...

Page 10: ...further null the offset You should be able to achieve a few 10 s of microvolts of offset between the differential outputs See the section on using the trim function for more information USB Input The...

Page 11: ...e amplitude It should be 1 000Vrms 4 0 96 to 1 04Vrms on all 4 output ports of the QA401 This is a single ended measurement with one input to the DVM taken from the center of the BNC and the other inp...

Page 12: ...sylum QA401 directory The file is named CalibrationData xml The contents of this file are parsed at startup of the QA401 application Once read the file isn t needed again until the next re launch So i...

Page 13: ...t any time Re calibration will overwrite any existing calibration file Attenuator Adjustments The QA401 attenuator is built from 0 1 resistors and should be nominally 20 dB The software assumes it is...

Page 14: ...e channel precisely The channel to channel variation is generally quite small 0 02 dB QA401 Basic Controls The QA401 application is shown below On the left side of the screen is the display area and o...

Page 15: ...uickly adjust something like the offset knob If you hold down the ALT key while adjusting the mouse wheel the knob will spin 10 times slower than if no key were pressed This makes it easy to fine tune...

Page 16: ...he dBV button for example has a dot in the lower left corner If we want to bring up a context menu related to the dBV settings we can click on that button while holding the control key down If a butto...

Page 17: ...ops the analyzer acquisition although that can also be accomplished with the space key see the section on soft keys In the first picture below you can see the analyzer expanded to full screen and the...

Page 18: ...o thinking that you are looking at test data from the device under test For this reason when you have selected to look at the output data you will be reminded with an on screen indication that you are...

Page 19: ...s point it s important to highlight that the QA401 does not operate with constant stimulus tones The QA401 operates with stimulus bursts The reason for this is to ensure that the full transaction with...

Page 20: ...inated mid cycle which might also result in a click or pop and it ensures the DC level is gently returned to zero Normally you ll be looking at the display with the following buttons pressed Freq Inpu...

Page 21: ...FS levels are absolute there is no adjustments to be made via context menu dBV Context Menu The dBV levels are also absolute but in dBV mode we can specify whether or not external gains are attached t...

Page 22: ...block as shown below The absolute peak levels are reported on the screen regardless of the Y Axis settings In the case below you can see the peak levels are also reported in watts because we specified...

Page 23: ...a level of roughly 6 dBV coming into the analyzer If you specify that the peak level is 14 dBr then the display will indicate the same as the absolute value you measured with your DVM The next two bu...

Page 24: ...and end display frequency The linear button also allows a center frequency and span to be set Recalling again the Axis controls the purpose of the default button is to permit you to zoom to your defa...

Page 25: ...oomed Upon releasing the drag the new area will be zoomed You can pan around the display area by dragging with your middle mouse button Below you see a detailed zoom of the display Press the Default b...

Page 26: ...e also accessed via the display context menu The simplest way to add a marker is to hover over the peak of interest and then press the m key or you can click the peak with the mouse Alternately you ca...

Page 27: ...you can remove all the markers via the graph area context menu activated by right clicking in the graph area Markers details will show up in the display area This allows us to the see the frequency o...

Page 28: ...y samples are averaged when the display values are computed Note that averaging doesn t change the noise floor but it does make it easier to see signals that might be buried in noise Since long averag...

Page 29: ...frequencies the weighting works to attenuate the values below roughly 1 KHz and above 4 to 5 KHz or so On the QA401 weighting can be applied or removed by pressing the A weighting button or the Off bu...

Page 30: ...oing this the extra half cycle that appears to immediately truncate will be suppressed The downside to this is that some other distortions will be introduced into the displayed spectrum But the introd...

Page 31: ...ve is chopped off With windowing turned off Rect we see the resulting spectrum below Notice how much energy there is across the entire band even after 10 KHz This is due to the truncated waveform But...

Page 32: ...t do we see then The response looks worse again What is happening It turns out that windowing functions are very complex and you should set them based on what you are trying to measure Any window opti...

Page 33: ...ss a procedure calls specifically for this window you ll want to use Hanning Hamm The Hamming window is similar to Hann but with a bit more spectral leakage Generally unless a test procedure calls for...

Page 34: ...nyq This is the root sum square or all components from the Nyquist Frequency down to but not including DC N Noise This is the non signal and non harmonic signals contained in the specified spectrum Mo...

Page 35: ...n the plot below we can see a few key pieces of data related to this measurement First we can clearly see the measurement is performed over the 20 to 20 KHz interval Next we can see the total power me...

Page 36: ...7 5V is applied this is roughly a 10 mA transient current In other words measuring a power supply s noise with an output greater than 7 5V requires special consideration The easiest way to solve this...

Page 37: ...e can see this a bit easier below The THD function will sum the harmonic powers all the way up to the specified Measurement Stop In the plot above the sum of the harmonic power is 107 1 dB To go from...

Page 38: ...armonic will be at 22 KHz which is beyond the 20 KHz Measurement Stop limit In that case the second harmonic will never be seen and the THD value won t make much sense In the example below we can see...

Page 39: ...important it s important that you can readily see what the software has selected for the fundamental frequency Notice below that a small green F has been drawn near the X axis This way you can be cert...

Page 40: ...highlighted numbers above The peak value is 10 dBV which is the level of the signal generator and Noise Distortion is measured as 95 5 dBV and thus this means the ratio of the signal to the noise and...

Page 41: ...ple rate Farina Chirp This is an exponentially swept sine following the formula specified by Farina with a start frequency of 20 Hz and a stop frequency of 20 KHz regardless of sample rate White Noise...

Page 42: ...se Looking at the input frequency we see a flat line at an arbitrary amplitude The amplitude depends on a variety of settings and the response of the DUT In the plot below we are in pure loopback mode...

Page 43: ...an zoom in and see the loopback frequency response of the QA401 at 192Ksps In the plot below the 3 dB point is roughly 1 Hz to nearly 80 KHz This is easily measured by stopping the capture and then lo...

Page 44: ...eraging both large FFT sizes and signal averaging As discussed above the impulse measurements are most helpful when characterizing circuits wired directly to the QA401 The white noise might be more us...

Page 45: ...se frequency If you select Round to Eliminate Leakage then the frequency you select will be nudged a bit higher or lower to ensure that it sits precisely in the center of a frequency bin This will dra...

Page 46: ...each value will change when you rotate your mouse wheel above the Freq and Amp knobs And again if you press the control key while adjusting the knob the knob will spin 10X faster And if you press the...

Page 47: ...2 KHz etc As the marker shows the 1 KHz tone is roughly 100 dB below the input tones and thus the IMD shown is roughly 0 001 Another common IMD measurement is commonly known as the SMTPE IMD measurem...

Page 48: ...he region of interest are the IM products around the 7 KHz tone Zooming in we can see these in great detail thanks to the high resolution FFT in the plot above Notice the 7 KHz 60 Hz harmonic is tight...

Page 49: ...f the art today for LDOs is below 1uV in the audio band The safest way to measure the noise of a power supply is to use a resistor divider to drop the power supply voltage to under 5V For example if y...

Page 50: ...e General dialog is used to adjust the system sample rates The 192 Ksps will be more demanding on hardware resources and as a result might not be usable on older or slower systems Display The Display...

Page 51: ...vices that might have longer processing delays For example if you are testing a codec or a system that involves digitization and transmission reception then there could be 50 mS or more of latency in...

Page 52: ...s by increasing the FFT size With the 1 50 release and later the ability to increase the pre buffer will permit the burst length to grow Keep in mind the latency compensation depends on the current sa...

Page 53: ...re the output of a BNC relative to its outer conductor and you ll notice a slight offset around 1 or 2 mV By adjusting the output trim you can null that reading to very near zero The reading is shared...

Page 54: ...know or calibrated and thus when you specify a tone level of 0dBFS the PC will generate a maximum valued tone 6 dBV will generate a half value tone etc Second the PC PC audio will start and stop along...

Page 55: ...at 7 points per octave you d fill out the THD measurement as follows hit start test and the system could build a list of about 450 measurements to make and then make those measurements automatically...

Page 56: ...king on a peak D This will delete all visible markers Deleting an individual marker can also be achieved by clicking on the marker Space This is the same as the Run Stop button Pressing this will togg...

Page 57: ...r and confirm the driver is loading properly When you plug in the analyzer you should hear an audio indication that the analyzer has been plugged in If you do not plug in another USB device that is kn...

Page 58: ...If the driver has not installed then you might have heard some tones indicating there was an issue or a message might have popped up explaining the problem You should see the device listed in the othe...

Page 59: ...rectory of the installed location At this point the driver should install itself Step 3 Run the application and confirm it can connect At this point you have confirmed the drivers have been correctly...

Page 60: ...QuantAsylum QA401 User s Manual Page 60 unplug and re plug the QA401 If it still doesn t connect then re boot your machine For problems beyond that please contact QuantAsylum support...

Page 61: ...the QA401 from within the application This is helpful for performing swept measurements measurements that are repeated over and over with a single variable changing And example of a sweep is shown bel...

Page 62: ...QuantAsylum QA401 User s Manual Page 62 If you d like to write a DLL plugin contact us at the support alias and we can provide some sample code...

Page 63: ...ll shows up in the Visualizer menu menu list as shown below There is a DotNet interface embedded in the QA 401 executable that appears as below namespace QA400NS public interface IVisualizer string Ge...

Page 64: ...e as follows 1 Using Visual Studio create a new project that is a DLL 2 Add a reference to the QA400 application 3 In your DLL class inherit from the QA400NS IVisualizer 4 Implement the required funct...

Page 65: ...Otherwise the indicated settings file is loaded If indicated file name was successfully loaded then true is returned If the filename is empty then true is always returned and default is always loaded...

Page 66: ...in degrees 180 to 180 The input signals must be sine waves of the exact same frequency The expected use of this function is as follows In situations where you are measuring a DUT using a single sine g...

Page 67: ...be rounded up to the next power of 2 summary param name samples param void SetBufferLength uint samples void SetMuting QA401 Muting muteState summary Generates a continuous tone on the QA401 hardware...

Page 68: ...personal computer or any other electronic device in your community Power Supply This device does not operate from line or mains voltage It is designed to be powered from a low power USB connection Ma...

Page 69: ...QuantAsylum QA401 User s Manual Page 69 Appendix 5 Specifications See the QA401 Product Brief located on the QA401 product page on the QuantAsylum web site for the product specifications...

Page 70: ...QuantAsylum QA401 User s Manual Page 70...

Reviews: