


TECHNICAL SUPPORT: [email protected] | (760) 727-0300
PG. 18
THIS DOCUMENT IS PROPRIETARY AND CONFIDENTIAL. © 2021 PRECISION MEASUREMENT ENGINEERING, INC. ALL RIGHTS RESERVED.
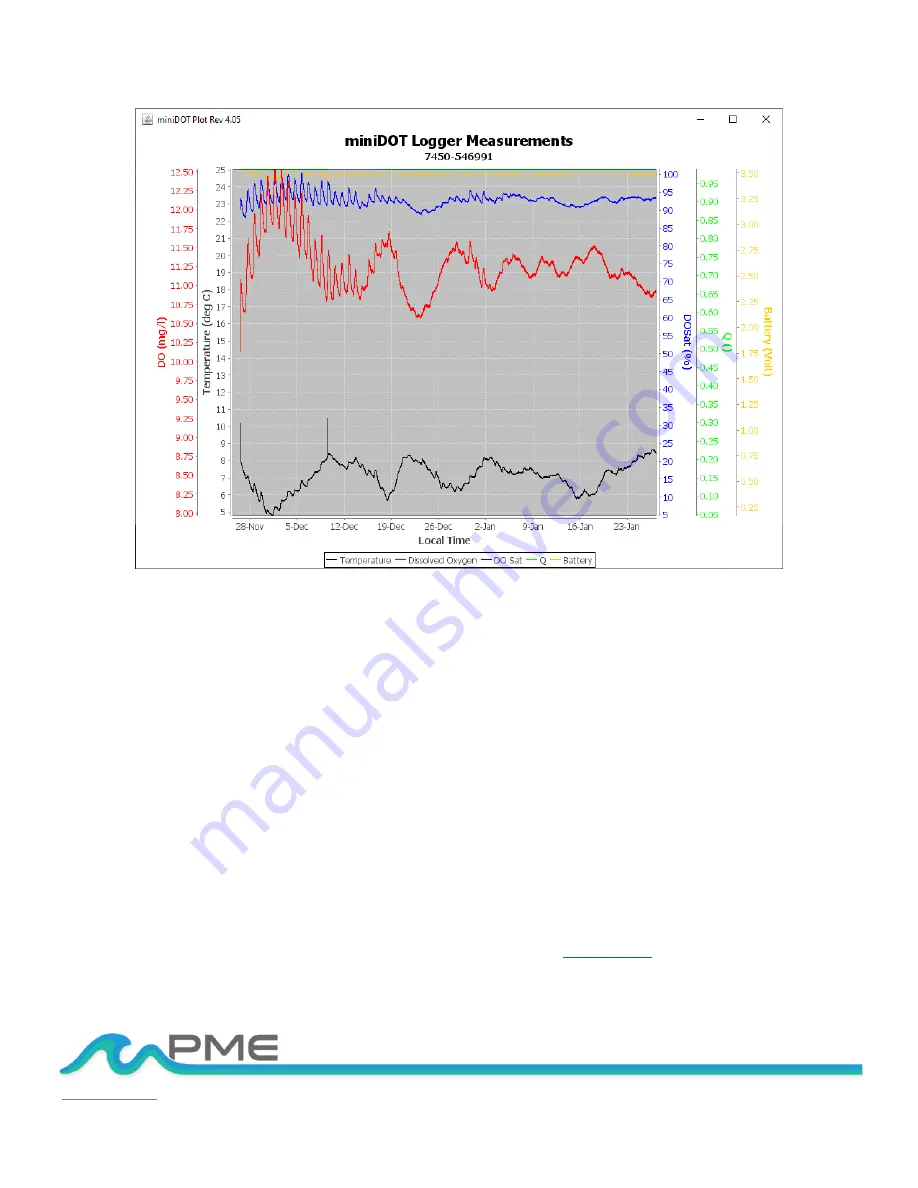
You may zoom this plot by drawing a square from upper left to lower right (click and hold left mouse
button) that defines the zoom region. To zoom completely out, attempt to draw a square from lower
right to upper left. Right click on the plot for options such as copy and print. The plot can be scrolled
with the mouse while the Control key is held depressed. Copies of the plot can be obtained by right
clicking on the plot and selecting Copy from the pop-up menu.
Different DATA Folders can be selected during one session of the program. In this case the software
produces multiple plots. Unfortunately, the plots are presented exactly on top of one other and so
when a new plot appears it is not obvious that the old plot is still there. It is. Just move the new plot
to see previous plots.
The program can be re-run at any time. If an already processed DATA Folder is selected, then the
progrm simply reads the miniDOT Clear Logger’s measurement files again.
End the miniDOT Plot program by closing the window.
Special note: plotting of sample sets of more than 200K samples may consume all the memory
available to the JRE. The miniDOT Plot program will present a partial plot and freeze in this case. A
simple solution is to separate the files into multiple folders and plot each folder individually. A special
miniDOT Plot that sub-samples can be provided by PME. Please


