background image


The panel right shows the 
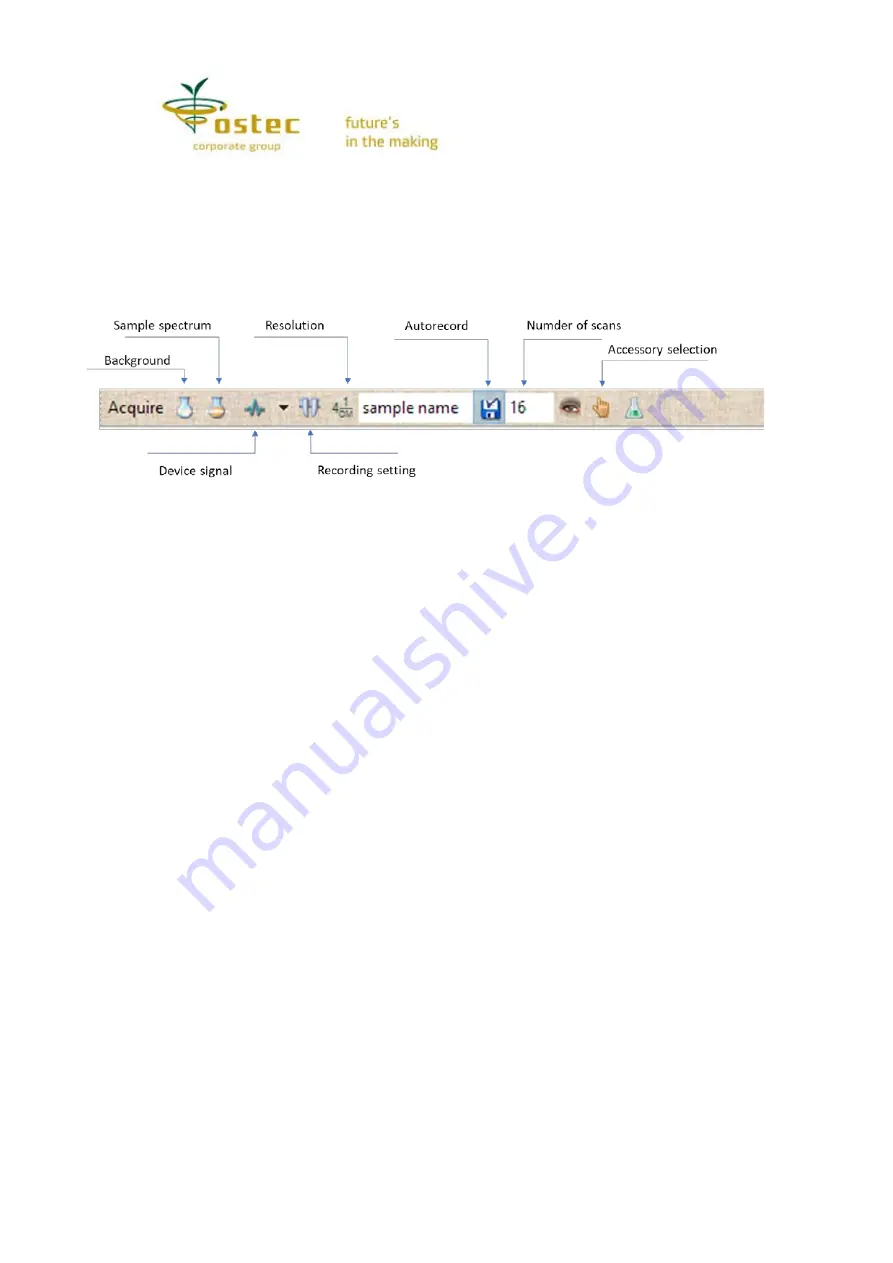
Number of Scans

  (or accumulations) set for spectrum 

acquisition. If a scan (interferogram) meets the maximum position restrictions, then it is used 

for spectrum calculation. The spectra for serial scans are averaged and the result is displayed 

on the screen. Thus, the spectral image keeps updated until a required number of spectra is 

accumulated (however, there can be more scans in case some of them are discarded). Larger 

accumulations help reduce spectral noise. The noise does not show any significant changes 

after 50 scans under ordinary conditions. 


Figure 3. The main spectrum recording parameters and commands 

If the 

Autorecord

 button is on, all spectra recorded on the device are automatically 

saved on the drive under the name indicated in the 

File Name

 field. You can set any name in 

this field. The default name is the current date and spectrum number. The spectrum is saved 

in the folder that corresponds to the active list at window top of the software, the 

corresponding line becoming selected. The current spectrum can be saved again under any 

name using the 

Save spectrum

 command (the 

File

 toolbar). 

Background spectrum

. Before obtaining a sample spectrum, record a background 

spectrum that will help take into account the impact of the atmosphere, fillers and other 

recording conditions. If you introduce a sample using accessories (add-ons), put them in the 

device cell holder without the sample only. Liquid cells are an exception: do not put one in the 

device as the beams reflected from an empty cell distort the spectrum. Then click the 

Background Spectrum

 button or press 

Shift+F9

The spectrum recording time is proportionate to the number of the scans and can take 

a few seconds. Meanwhile the window displays a spectrum for the actual number of  
accumulations, the number being shown in the status bar (the bottommost of the program 

window). 

The obtained background spectrum is displayed in the window in a typical bell form. 

Further, sample spectra will be divided by the background spectrum, which will help eliminate 

the recording environment effects. You can use a previous background spectrum recording as 

a reference spectrum. To do so, read the spectrum, then right-click on the spectra field and 

choose 

Record 

 Use as background spectrum

 in the context menu. This is usually done if 

you cannot restore the background recording conditions. As the number of points in a 

spectrum depends its resolution, each resolution requires its own background spectrum. 

When you select a resolution and an appropriate background spectrum has already been 

obtained and recorded, it will load and apply automatically. If you try to obtain a sample 

spectrum without a background spectrum, the program will prompt that you need first to 

obtain a background spectrum. 

Sample spectrum

. Prepare your sample, put it in the cell holder and click the 

Sample 

Spectrum

  button or press 

F9

. The spectrum accumulation progress is displayed in the 

window until you get a required number of scans. As a rule, you can set a smaller number of 

scans than that for a Background spectrum. The sample spectrum is automatically cropped 

by the frequency band previously set in the recording settings.


Summary of Contents for 4434-801-59962935-08

Page 1: ...IROS 05 IR Fourier Spectrometer Operating Manual FSVE 443430 005RE 2020 Ostec Instruments Moscow...

Page 2: ...specialists who have read this manual are qualified to work on electrical devices up to 1 000 V and briefed on workplace safety rules The spectrometer involves operations with hazardous 220 V 50 Hz c...

Page 3: ...n 6 Device software installation 6 First run 7 Spectrum recording 7 Spectrum reading and copying 9 Spectrum identification 12 Viewing spectra 15 Spectrum editing 18 Calibration 19 Creating and editing...

Page 4: ......

Page 5: ...434 801 59962935 08 Please see spectrometer operating conditions in Table 1 Spectrometer s electromagnetic interference resistance complies with GOST 30804 6 1 2013 and radiated interference with GOST...

Page 6: ...ise ratio RMS in standard conditions in1 min at a resolution of 4 cm 1 in full bandwidth of 2000 2200 cm 1 40 000 Signal gain 1 2 4 8 Resolution 0 5 1 2 4 8 cm 1 Scanning speed spectra per minute For...

Page 7: ...1 Spectrometer optical scheme The inlet optical system 2 converts the IR source 1 radiant energy into a convergent annular beam and makes it focus on the inlet port of the interferometer 3 consisting...

Page 8: ...log to digital conversion is done at equal intervals of the optical path difference intervals The path difference reference scale is generated in a reference channel that consists of a HeNe laser the...

Page 9: ...t 2 the Scan light 3 peripheral equipment connection ports 4 sample compartment 5 MCT detector compartment cover 6 spectrum recording control buttons Note The photo displays the device in basic config...

Page 10: ...right sides The Power switch on the rear side of the device case near the 220 V power connector Device software installation First turn on the computer Run setup exe on the USB flash drive that comes...

Page 11: ...r icons there indicate scan errors Single errors can be caused by the device being pushed or shaken If errors keep occurring or the LED on the case stops blinking and the software window indicator loo...

Page 12: ...the beams reflected from an empty cell distort the spectrum Then click the Background Spectrum button or press Shift F9 The spectrum recording time is proportionate to the number of the scans and can...

Page 13: ...triangle to the right of the button and select you add on from the list Note that the scan number resolution and other recording settings apply to the current selection so switching to another add on...

Page 14: ...You can make any folder a home folder by opening it a clicking a context menu command Thus you can navigate the folder system on the disk through the list You can also open logical spectrum folders th...

Page 15: ...ial if you edit it the file is renamed As the Number field has the line number entering a number in this field results in the line under this number selected e g you can use this feature to get a spec...

Page 16: ...The Acceleration option involves all the CPU cores and multiplies the search speed almost by the number of the cores The Reset to initial values button restores the default values applicable to ordin...

Page 17: ...cating the number of each of them or the range using a hyphen e g C17 N3 5 02 Cl note that you do not have to use 1 Add to your formula if you want it to include any other elements except the listed o...

Page 18: ...ick the View button you can display them in advance Use the Compare button for comparison with the current spectrum and band coloring Use the Purge button to completely delete a peak list The From cur...

Page 19: ...rve The last open spectrum is marked as number 1 the previously opened spectra are numbered in an ascending order by adding one Any curve can become number one if you click on it You can also change t...

Page 20: ...ht Note that these variants do not affect the view if only one curve is open Sample spectra can be displayed both in the transmittance scale the quotient of two spectra current and background for each...

Page 21: ...he dependence of the spectrum current ordinate on the abscissa and vice versa Current X and Y are marked with dashed lines Their values are specified in the text fields at the graph edges You can use...

Page 22: ...it will change the base line or amplitude of the current spectrum in the area of the cursor moving If you magnify the curve images then your edits will be more accurate Plotting border lines involves...

Page 23: ...luted multiple times and recorded again Continue diluting until the peak of the substance to be identify appears on the spectrum For greater accuracy we recommend that you repeat the entire procedure...

Page 24: ...calculating concentration for that peak Consequently if a peak has graph a relevant concentration will show up near the peak height Creating and editing libraries As noted above spectrum libraries are...

Page 25: ...rogram If it does not help unplug and plug the USB cable back in Next turn off the device wait for a minute turn it on again and restart the program If it does not help restart the computer 2 Fault sc...

Page 26: ...rding settings set a different number where necessary If the channel number is correct check the sample compartment for foreign items or pollution 6 Fault software failure Manifestation the program do...

Page 27: ...ery two years Use the Calibration command in the Recording menu or the toolbar button The procedure is performed in the Master mode and consists of five steps Note that you may take measurements in an...

Page 28: ...equires a reference film and a comparison spectrum If you do not have them contact the spectrometer manufacturer or get a thin polystyrene layer ca 0 25 mm and record its spectrum and set the spectrum...

Page 29: ...n measuring precision are assessed at the next step This measurement is the most time consuming and can take a few minutes Its results are entered in the parameter list At the final step click the Rea...

Page 30: ...onditions are the same as the operating conditions Table 1 Place the spectrometer at least 10 cm away from the warehouse floor and walls and at least 50 cm from the heat sources Transportation and sto...

Page 31: ...measuring attenuated total reflection and specular diffuse reflection spectra It consists of a hold down 1 FTIR and SDR flange seats the seat shown covered with a plug flange 2 in Figure 12 The plug...

Page 32: ...remove the sample and clean the hold down tip and crystal surface with an alcohol or other solvent wetted cotton pad Liquid samples are placed at the FTIR element center in the form of a tiny drop do...

Page 33: ......

Reviews: