Ostec 4434-801-59962935-08, Operating Manual
The Ostec 4434-801-59962935-08 operating manual is essential for maximizing the performance of your device. Easily download the manual for free from manualshive.com to ensure proper usage and maintenance. This comprehensive guide provides detailed instructions and troubleshooting tips to keep your product running smoothly.
Share
Download


Reviews:
No comments
Related manuals for 4434-801-59962935-08

UD-211-002-200
Brand: Unex Pages: 5
H5000 Pilot
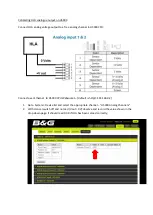
Brand: B&G Pages: 3

1500
Brand: Dawn Pages: 8

VIO
Brand: BACtrack Pages: 13

FLEXI
Brand: Badgematic Pages: 28

Select S80
Brand: BACtrack Pages: 2

STELLA
Brand: MADRIX Pages: 28

microLAN
Brand: BACTcontrol Pages: 28

911
Brand: dbx Pages: 12
QUANTUM
Brand: dbx Pages: 13

1066
Brand: dbx Pages: 72
AFS224
Brand: dbx Pages: 11
566
Brand: dbx Pages: 16

POCKET
Brand: VBM Pages: 36

Lara
Brand: W&H Med Pages: 122

UltraPro
Brand: Jasco Pages: 2

Plate
Brand: Vahterus Pages: 31

BeamLine VL800
Brand: Vari Lite Pages: 14


