17
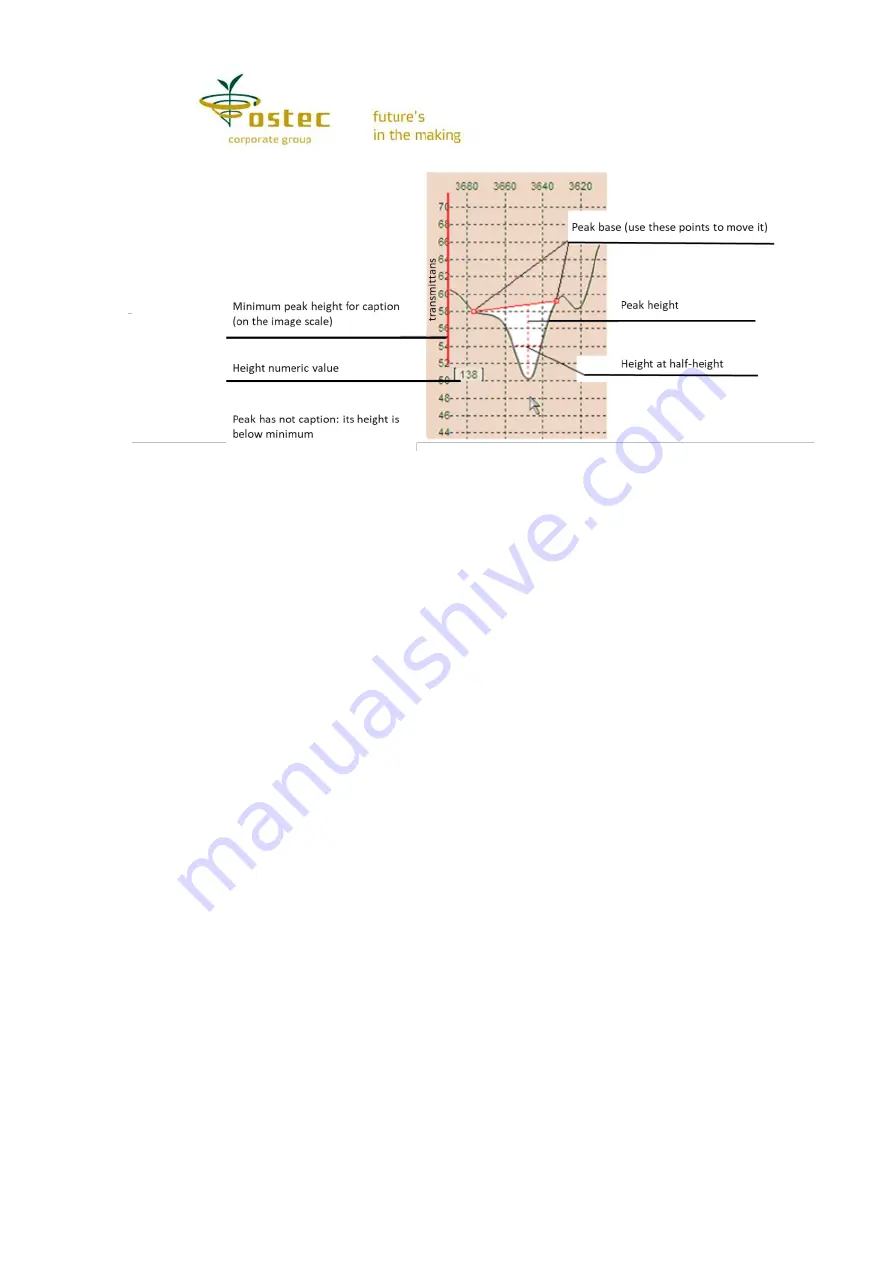
Figure 8. Selecting a peak without caption
A peak height is usually measured from the summit to the base along the vertical axis.
However, if the broken base line edit mode is on (see
Edit mode
), the height is measured to
the base line.
If a caption is placed inconveniently, you can move it by the text border. You will not
delete a caption if you drag it outside the window. If you click the text itself, an edit field will
pop up for you to edit the caption.
Curve captions (window)
. With this button on, a semi-transparent window pops up
with curve captions and colored marks that help march the curves and compounds. You can
move the caption window across the screen and change its size. Use its context menu to
change the window opacity, color and caption contents. The
From
field means the file or
library name and the recording number in it that corresponds the spectrum.
Curve captions (marks)
. These are the same captions with the same composition,
however, not in a window but in the form of marks connected with the curves. You can edit
and drag these captions the same way as the peak marks, the curve anchor point also moving
keeping close to the text.
Current X, Y
. With this button on, you can monitor the dependence of the spectrum
current ordinate on the abscissa and vice versa. Current X and Y are marked with dashed
lines. Their values are specified in the text fields at the graph edges. You can use these fields
to enter the values you need for one axis and read the corresponding value of the other axis.
You can drag the dashed lines with the mouse.
Properties
. The
Properties
button shows a window where you can see and edit the
first spectrum parameters. However, if you point the cursor at another curve or its icon and
click
Properties
in the menu, the parameters will be of another spectrum. Click the
Save
or
Apply
button after changing the parameters. The
Apply
command does not save the data on
the drive but when you close the spectrum, the program will prompt you to save it. The gray
field data are not subject to editing. The
Not smooth
property means that your spectrum will
be a broken line drawn from point to point without the usual spline. The
Hidden
property is
the same invisibility as discussed above.
X, Y ranges
. This button shows a window of the same name where you can view and
set the spectrum ranges to be visible in the window on both coordinate axes. The
Average
and
SD
fields show the data of the first (black) curve in a given abscissa range (X-axis). If the
curtains in the window are enabled (the
Search range
), the abscissa range corresponds to
the curtains, not the window edges.