15
The last tab,
Library
, is for setting the libraries for search. First, indicate the ones
available on the computer or local network. To do so, click the
Add
button, find the library file
folder, mark the files and click the
Open
button. The
Delete
button, on the contrary, excludes
marked libraries from the list (however, they are not deleted from the drive and can be added
later). Then mark the libraries in the list that will be used in your search (all items in the list
are marked by default). To mark more than one line, press
Ctrl
or
Shift
(just like in the
Explorer). The
All
button marks the whole list, and
Inv.
inverts your selection. The number of
selected libraries and spectra in them is indicated in fields
Lib.
and
Sp.
Note that the list
content coincides with the logical
Libraries
folder. When it is open in the list window, you can
add, delete, mark individual libraries for search using context menu commands the same way.
Viewing spectra
Each open spectrum in the spectrum field (program window bottom) has its own
sequence number and a curve color. By default, the first curve is black, the second is red, the
third is dark green etc. The status bar at the window bottom each curve has a corresponding
icon of the same color and number. Absent curves are marked with a dashed line. The
maximum number to display is 16 curves. You can change curve colors (and other properties)
through the context menu by right clicking above the curve or its icon. All operations (search,
edit) are usually performed on the first curve. The last open spectrum is marked as number 1,
the previously opened spectra are numbered in an ascending order by adding one. Any curve
can become number one if you click on it. You can also change the curve sequence by dragging
them to a new position. If the position is occupied with another curve, they will exchange
positions; if the position is empty, the curve will be duplicated. If you drop an icon outside the
status bar, the spectrum will close. You can also close a spectrum through its context menu.
The
File
toolbar can also be used to
Close all spectra
or
Remove the last curve
(i.e. the curve
with the biggest number). On the contrary, the
Remember curve
command copies the first
spectrum to the nearest vacant position.
Deletion, however, does not apply to invisible curves. An invisible curve does not show
up in the spectrum field and its presence is marked with a hashed icon. Double click the curve
icon or use the menu to turn invisibility on or off. You can use this function to protect a
spectrum against accidental deletion.
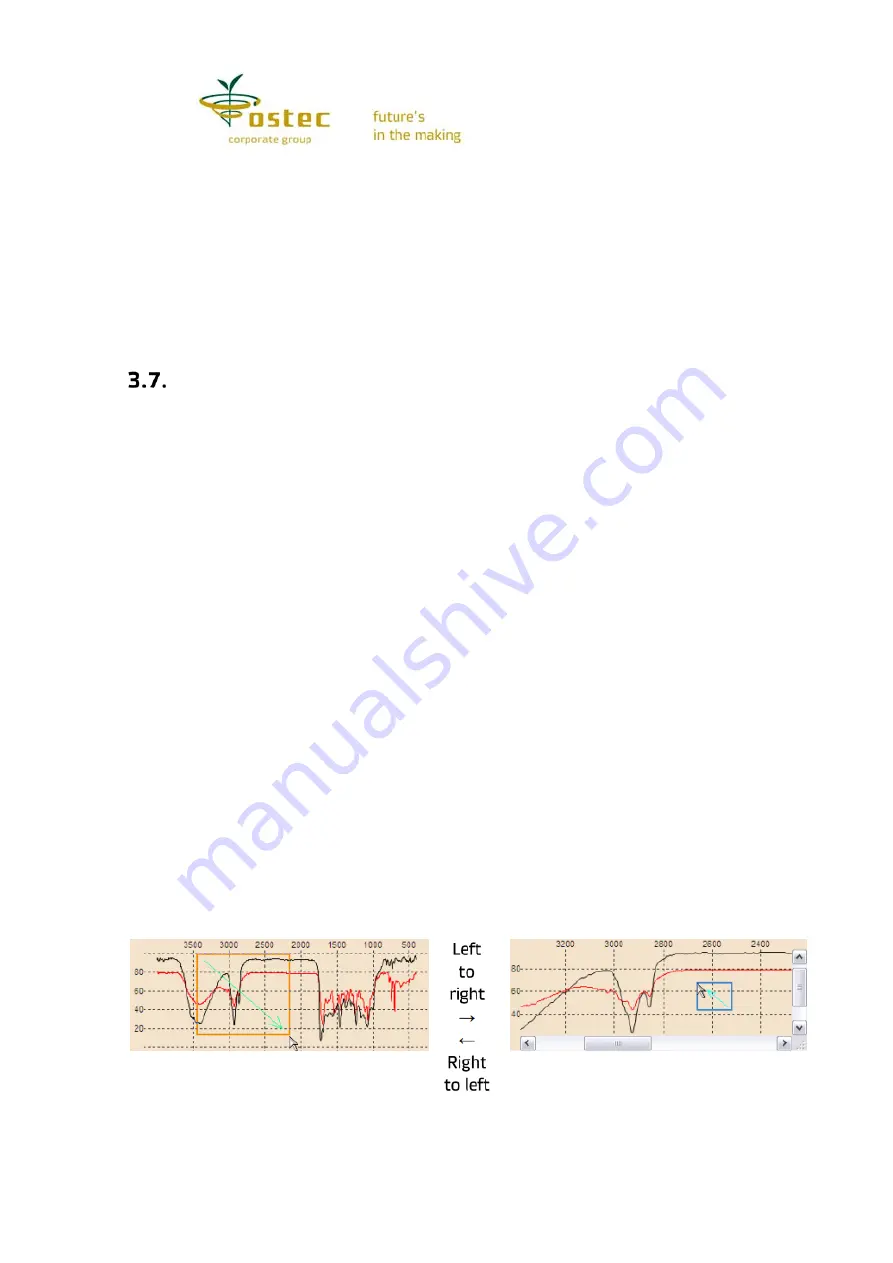
You can zoom in or out spectral curves. To zoom in a curve fragment drag the cursor
from the fragment top left to the bottom right corner with the left mouse button pressed. On
button release, the rectangle drawn will fill the window (Fig. 7). Drag from left to right only,
to expand your spectrum horizontally without changing the vertical scale. Similarly, move the
cursor from top to bottom to expand your spectrum vertically. You can scroll a zoomed-in
spectral image dragging it with the left mouse button or using the scroll bars. To return to a
full-scale image, drag the cursor from right to left with the left mouse button pressed.
Figure 7. Scaling curves with a mouse


