


e-mail: [email protected]
For latest product manuals:
omegamanual.info
Shop online at
omega.com
®
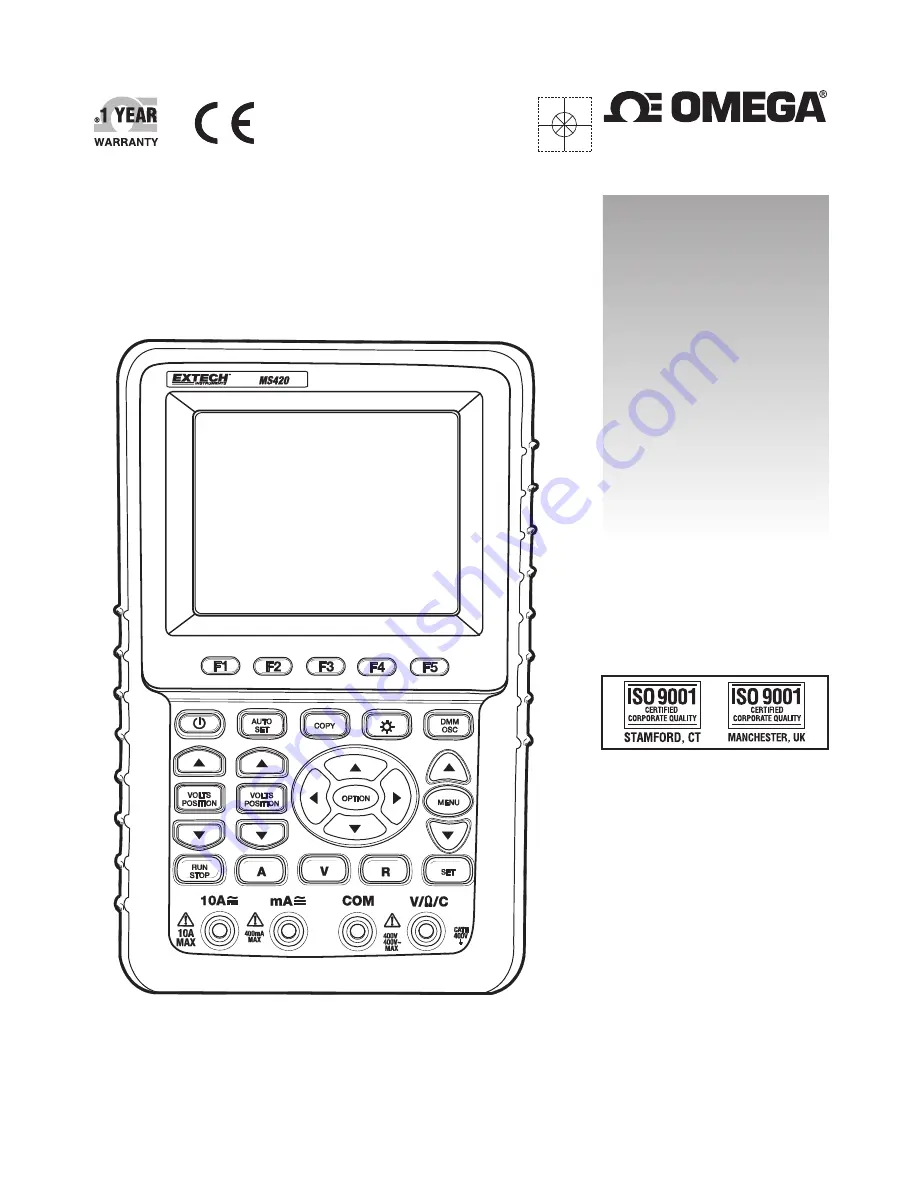
User’s Guide
HOS-MS420
20mhz Oscilloscope
MADE IN CHINA
1
Summary of Contents for HOS-MS420
Page 11: ...10 V5 1 March 2010 FRONT PANEL AND KEYPAD OVERVIEW Figure 3 ...
Page 32: ...31 V5 1 March 2010 Figure 20 AC Coupling ...
Page 72: ...71 V5 1 March 2010 Fig 42 Rectangle window Fig 43 Blackman window Fig 44 Hanning window ...
Page 79: ...78 V5 1 March 2010 ...
Page 85: ...84 V5 1 March 2010 Figure 4 Continuity Test ...
Page 89: ...88 V5 1 March 2010 ...
Page 91: ...90 V5 1 March 2010 Figure 10 400mA AC Current Measurement ...
Page 95: ...94 V5 1 March 2010 ...


