29 |
M 5 7 9 0
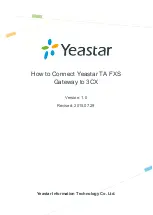
Graph Data Presentation
The Historian interface provides three methods of presenting graphed data:
Plot Time Series
,
Plot
Histogram
, and
Plot Prediction
.
Figure 42: Graph data viewing options
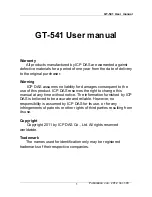
Plot Time Series
Figure 43: Plot time series graph view
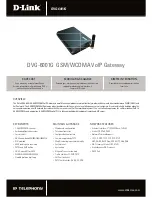
Plot Histogram
Figure 44: Plot Histogram graph view