Operating Modes
75
7.7 Thermo Graph
The operating mode Thermograph offers a real time display of the measured results of FS-Thermoscan.
To begin the function of the “Thermo Graph”, simply connect the FS-Thermoscan to the eXp 4500.
In Illustration 7.39
you can see a typical display when you are working in the operating mode
Thermograph.
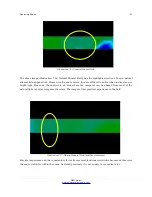
The monitor is subdivided in 2 parts:
•
Snap-Shot
The snap-shot on the bottom side of the monitor shows the current increasing or decreasing
measured values. During the Ground Balance the zero point will be determined and all following
measured values will be indicated as a deflection to the right (increasing temperature) or a
deflection to the left (decreasing temperature).
•
Trend Chart
The trend chart on the upper part of the monitor show differences in temperature also in a date
back period of about 10 seconds. In this way differences in temperature can be represented
visually.
The operating mode “Thermo Graph” can also be used for the Calibration. Do not pay attention to the
position of the indicator of the Analog Display, instead of that please pay attention to the deflection of
the Snap-Shot.
OKM GmbH
www.okmmetaldetectors.com
Illustration 7.39: Thermograph Display
Trend Chart
Snap Shot
Illustration 7.38: Thermograph Icon
Summary of Contents for eXp 4500
Page 1: ...FS Future Series eXp 4500NT Version 1 5 User s Manual ...
Page 5: ...5 9 2 Control Scans 93 OKM GmbH www okmmetaldetectors com ...
Page 9: ...1 Introduction CHAPTER 1 Introduction ...
Page 14: ......
Page 35: ...3 Technical Specifications CHAPTER 3 Technical Specifications ...
Page 39: ...4 Scope of Delivery CHAPTER 4 Scope of Delivery ...
Page 44: ......
Page 78: ......
Page 88: ......


