MNL-1007 REV A
20
o
If operating in continuous mode: The software will make consecutive
measurements and automatically update the plotted data. Click
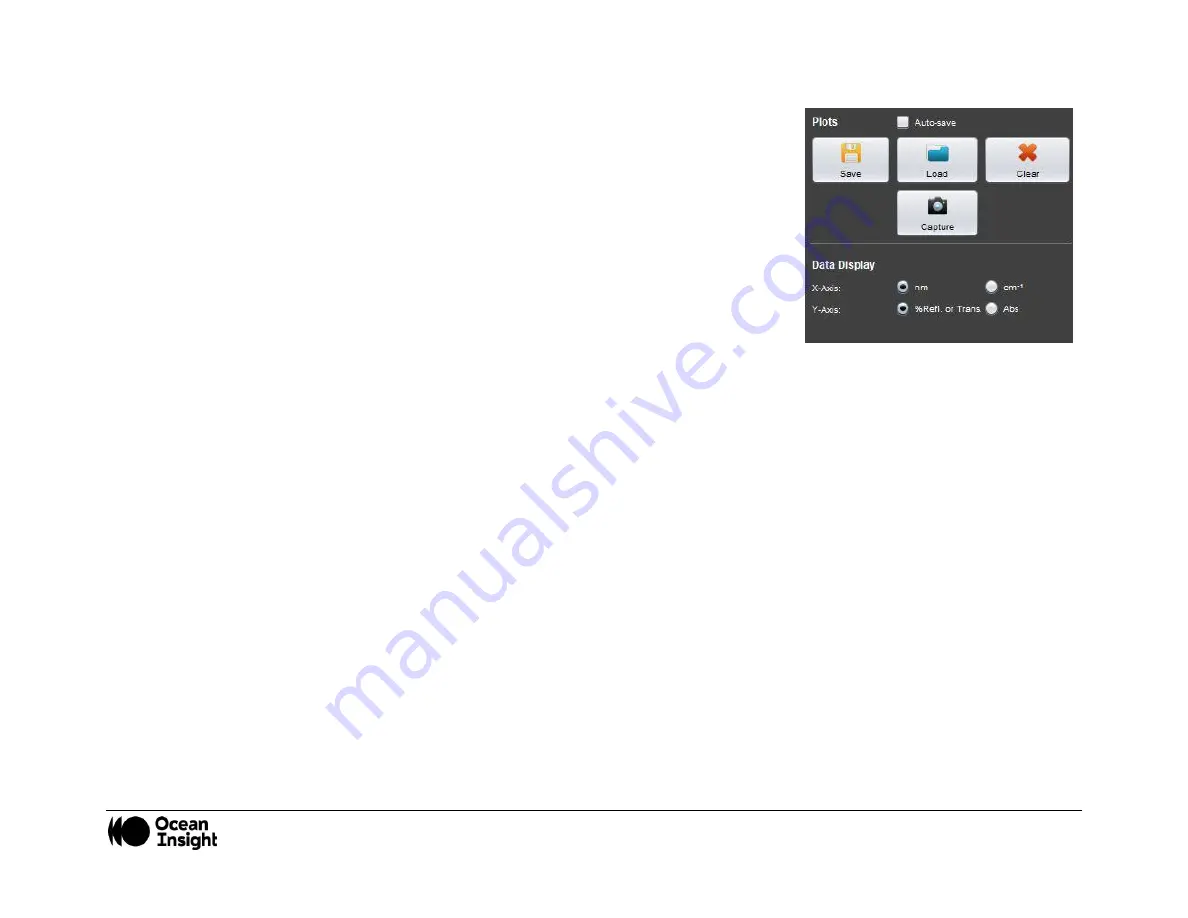
Capture
to
capture a measured spectrum that is displayed on the screen or click
Stop
to stop acquisition of new spectra.
4.
Post-measurement actions:
•
Save plotted data (all plots in the
Spectrum display
will be saved).
•
Load previously saved spectra.
•
Plots are saved in a file with the extension
.spectrum
. They can be easily viewed in
a text reader and converted to other readable formats.
•
X-axis and Y-axis data units of displayed data can be changed based on user
preference.


