


User Manual for Multi-parameter Patient Monitor North-vision Tech. Inc.
-
20
-
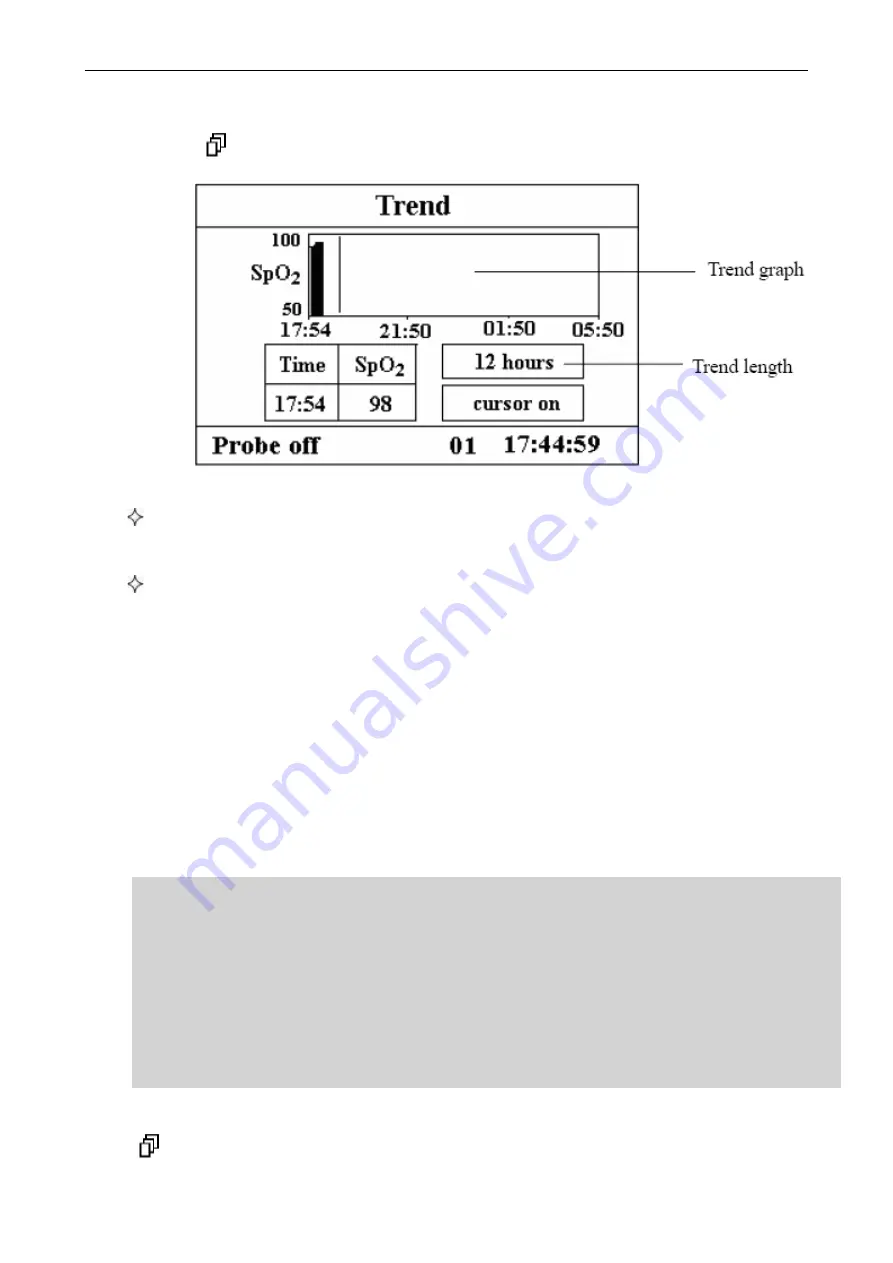
4.2 SpO2 Trend Graph Display
Short pressing “
Display” key to shift the screen view to trend graph display screen, as shown in
Figure 4.3.
Figure 4.3 Trend Graph
“12 hours”: the trend length of trend graph; three options: “12”, “24” or “96” hours;
when the selection is 12 hours, the upper trend graph will display SpO2 trend curve
for last 12 hours.
“cursor on”: enable the display of cursor on trend graph, i.e. the vertical cursor line
displayed in trend graph, so the user can move the cursor to inspect the SpO2 value at
the given time.
Operation Instructions
1. Press “▲” key or “▼” key to highlight “trend length” or “cursor on” selection.
2. Press “■” key to confirm.
3. Press “▲” key or “▼” key again to select value of trend length (12/24/96 hours) if the
selecting box stays in “trend length” option, or to move the cursor if the selecting box stays in “cursor
on” option.
Instructions for viewing the trend curve:
● Select “cursor on” and press “■” key to confirm, and “cursor on” becomes “cursor off” ,
then you can press “▲” key or “▼” key to move the vertical cursor, the list box below
will display SpO2 value and the time value at the point where the cursor stays. Move
cursor back and forth this way, you can view the SpO2 trend (12/24/96 hours long). Press
“■” key again to exit trend viewing.
● When pressing “▲” key or “▼” key to move cursor, the moving step is variable. The
rule is that the initial step is 1 point, after pressing “▲” or “▼” key towards the same
direction for 5 times, the step becomes 5 points, and with 5 more pressing the step
becomes 10, then 20. No matter what step is, as long as you press “▲” or “▼” key towards
the other direction, the step becomes 1 and towards the other direction.
4. press
:
“
” key: press this key to shift to next display view.


