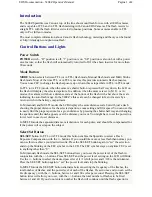
12
The Monitor/Viewfinder
Tone Level Information Display
You can check for loss of contrast detail in highlights and shadows from the
histogram that is displayed, or the flashing display for each tone level. These provide
guidelines when adjusting the image brightness with functions such as exposure
compensation.
1
A histogram is a graph showing the distribution of tones in the image. The
horizontal axis corresponds to pixel brightness, with dark tones to the left and bright
tones to the right. The vertical axis shows the number of pixels.
2
The tone level indicates the brightness level. When the tone level to check is
selected using the multi selector
JK
or rotating it, the area of the image that
corresponds to the selected tone level flashes.
0 0 0 4 . J P G
0 0 0 4 . J P G
1 5 / 1 1 / 2 0 1 6 1 5 : 3 0
1 5 / 1 1 / 2 0 1 6 1 5 : 3 0
4 / 4
4 / 4
F 5.6
F 5.6
1 / 2 5 0
1 / 2 5 0
+ 1 . 0
+ 1 . 0
1 0 0
1 0 0
1
2
3
4
5
6
13
14
10
11
8
9
12
7
1
Current image number/
total number of images
2
Histogram
1
3
Tone level
2
4
ISO sensitivity..............................................135
5
COOLPIX Picture Control .....................122
6
Image quality/Image size.........119, 121
7
White balance ............................................127
8
Time of recording ............................18, 160
9
Date of recording............................. 18, 160
10
File number and type............................197
11
Exposure compensation value............66
12
Shooting mode............................................34
13
Shutter speed................................................50
14
F-number .........................................................50


