background image


http://www.national.com


4


SMA Connectors 


The output clock SMA connector provides a signal that
can be used to phase lock a signal source. The
frequency is that of the input clock signal divided by 2.
For example, with an attached CLC5958 ADC evaluation
board at 52MSPS the clock output signal will be a 26MHz
square wave. The second SMA connector is
currently unused.


Serial Port


The serial port is configured at 115,200 baud with one
stop bit, no parity, and 8-bits per character. Although the
DSR, CTS, and RTS control signals are connected, they
are not used. XON/XOFF flow control is supported. The
flow of returned data pauses after an XOFF character
(DC3, ctrl-S, hexadecimal 13) has been received. The
flow of returned data resumes after an XON character
(DC1, ctrl-Q, hexadecimal 11) has been received. The
Data Capture Board initializes as if an XON character
had been received.


Power Up the System


Once the WCLK jumper and the DIP switches have
been set, (for example, for the CLC5956 we have set
WCLK at RDY2 and DIP switches 1,2,3,4,5 as
ON,ON,ON,OFF,OFF) connect the evaluation board to
the data capture board, apply power, clock, and signal to
the boards, and connect the serial cable to the PC. Some
PCs will need to be rebooted at this point, but it may not
be necessary with your PC. In the software configuration
section, next, we will check the communication between
the PC and the data capture board. 


Light Emitting Diode (LED) Status Monitors 


3 of the 6 LEDs are used to provide status indications.


LED 1:


 This LED is connected to an address line of the

static RAM ICs. While the static RAM is being
written or read, it blinks. After the Data Capture
Board is powered up and the FPGA is initialized, it is
on to indicate that the board is ready. After all the
SRAM data has been output, it is off.   


LED 2:


 This LED is on when captured data is available 

to be output to the serial port. After all the data has
been output, it is off.   


LED 6:


 This LED is connected to the clock signal

selected by DIP switch 1. When the clock is
toggling, it will be on at less than full intensity.   

So, at this point in your setup, you should have LED 1 on
at full intensity and LED 6 on at reduced intensity. You are
now ready to configure the software for data capture.   


Software Configuration


Run the program 


“capture.exe”


. It is located in the direc-

tory that you chose during the CD-ROM installation. The
default directory is 


“c:\nsc\”


. You can also use the start

menu: start


 programs


 nsc


 capture.

When you run 


capture.exe


, you will see the following

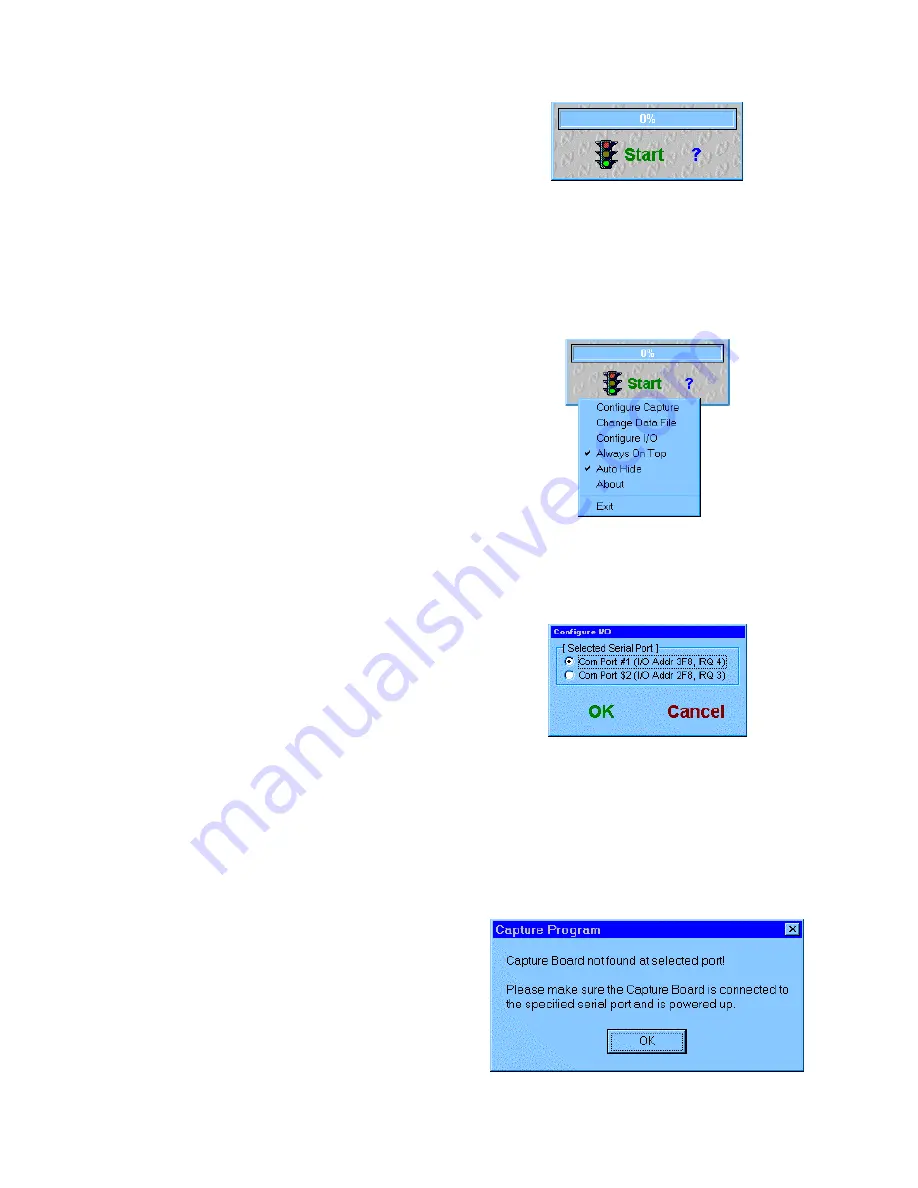
window  pop up onto your PC:

This is the data capture control panel. It is small to
conserve monitor area for other programs. The main
function of the panel is to initiate data capture. Before we
capture data we must configure the computer and the
board. By clicking on the 


control panel


 with the RIGHT

mouse button (right click), we bring up the following
configuration menu: 

The first thing to configure is the COM port on the
computer, so move the mouse to 


“Configure I/O”


 and

click with the LEFT mouse button. This will bring up the
following  menu: 

Select the COM port that you have attached to the data
capture board, and press 


“OK”


. The computer will then

send a command to the data capture board. If the data
capture board responds and the COM port interface is
operating correctly, the 


“Configure I/O”


 menu will disap-

pear, and the Data Capture control panel will return. If
there is a problem with the COM port interface, you will
get the following message: 

Summary of Contents for CLC-CAPT-PCASM

Page 1: ...s Receiver Transmitter an oscillator and a level translator IC The captured data is stored in either three 32K x 8 static RAMs organized into 24 bit words or in a FIFO containing 32K 18 bit words LEDs provide a visual indication of activity DIP switches and a jumper configure several capture functions Section II Capturing Data from ADC Evaluation Boards Getting Started To use the Data Capture boar...

Page 2: ...on board An amplitude of 10 to 16dBm is recommended Here again the HP 8644B is a good choice Software 1 National Semiconductor Software All of the required software is provided on a CD ROM To install the software now insert the CD ROM into your computer and follow the directions The default installation copies all of the files to a directory called c nsc The data capture software is called capture...

Page 3: ...ion board pin 20B The third jumper block J2 is unused Data Capture Board Block Diagram DIP Switches Five of the eight DIP switches are used to configure several capture functions as follows DIP switch 1 This DIP switch specifies whether a Diversity Receiver Evaluation Board or an ADC Evaluation Board is attached to the Data Capture Board ON ADC Evaluation Board is attached Captured data is aligned...

Page 4: ...he Data Capture Board is powered up and the FPGA is initialized it is on to indicate that the board is ready After all the SRAM data has been output it is off LED 2 This LED is on when captured data is available to be output to the serial port After all the data has been output it is off LED 6 This LED is connected to the clock signal selected by DIP switch 1 When the clock is toggling it will be ...

Page 5: ...you start with the default file name and location shown Click on Default and then on OK If you do not have a C temp directory please make one The reason for this is that the Matlab script files for data analysis look auto matically for the file C temp data dat If you wish to store the data elsewhere you will need to modify the Matlab m files to look for your data file in a different loca tion Obvi...

Page 6: ... configuration menu Select Histogram Debug as shown above and click on OK When the data capture control panel returns you can verify your capture settings by positioning the mouse over the progress bar You will see the following display When you press Start now the SRAM will be cleared and then the board will count the number of times each code is output When any count reaches the number that you ...

Page 7: ... and Capture Board combination require 5V at 1A 4 An IBM Compatible Personal Computer running Windows 95 Windows 98 or Windows NT with a serial port capable of 115 200 baud 5 Serial data cable to connect the data capture board to the PC 6 Low noise filtered IF Signal source for analog input to DRCS 7 OPTIONAL Low jitter clock source 10 16dBm sinewave if DRCS crystal oscillator is removed Software ...

Page 8: ...ion The SRAM is useful for displaying time records of data or collecting contiguous blocks of slower data that have been decimated by the CLC5902 DDC The SRAM is the memory element used for the board s hardwired histogram data generation Capture Board Hardware Configuration Options for DRCS data capture Place the WCLK FIFO write clock jumper in the PIN 120 position the VCORE should be in the 5V po...

Page 9: ...arted Next is a discussion of the Mode functions and the related sub functions MODES There are four primary modes in which to run the data capture system each with its own associated options 1 Capture mode configures the Capture Board for data reception from the DRCS evaluation board Both serial and the parallel output ports can be used as the source data path a The 24 Bits option captures serial ...

Page 10: ...ata source The DRCS Debug data will be displayed at the 15 bit resolution limit this is also the case for the DRCS 24 bit Serial Out data and the histogram will be centered about 16 384 assuming there is no intentional DC offset The following figure displays the sine wave histo gram data of the DRCS output generated by the Capture Board at an input frequency of 150MHz and 16dBm in amplitude using ...

Page 11: ...nditions The main portion of the noise power is contained in the carrier s immediate sidebands 5KHz Another point of interest is that there are several spectral lines about 75dBFS and 25KHz on either side of the fundamental These have been traced to the ground loop created by the PC serial interface Both serial interface cables were connected while this data was being collected Removing the cable ...

Page 12: ...e variable to 0 Setting the Dither variable excludes a lower portion of the spectrum from the FFT analysis and is intended to be used in conjunction with a base band dither signal being present at the ADC analog input 12 bit FFT b12_FFT m is the script intended for data analysis in conjunction with the CLC5956 Evaluation Boards DNL_INL dnl_inl m is the script intended for data analysis of the hist...

Page 13: ...13 http www national com CLC CAPT PCASM Evaluation Board Layer 1 CLC CAPT PCASM Evaluation Board Layer 2 CLC CAPT PCASM Evaluation Board Layer 3 CLC CAPT PCASM Evaluation Board Layer 4 ...

Page 14: ...1 1 1 1 1 6 287 287 287 1 9 9 1 1 1 1 1 1 1 6 6 287 9 9 9 9 5 9 9 9 9 1 4 5 2 2 5 1 57 4 4 9 4 3 3 1 1 5 5 1 2 9 1 4 1 4 602 9 4 1 4 4 4 4 4 4 9 4 4 1 4 4 1 4 56 1 1 1 1 1 865 21 B 21 6 7 7 7 7 7 7 7 7 B B B 1 B 1 B 1 B 1 9B2 1 17 1 17 1 17 1 17 1 17 1 17 1 17 1 17 1 17 1 2 1 2 1 2 1 2 1 2 1 2 1 2 1 2 1 2 1 2 1 2 1 2 1 7B 21 06 06 1 1 2 1 21 1 6 1 9B 5 156 167 786 17567 1 6 1B 1B 1B 1B 1B 1B 1B 1B...

Page 15: ...to perform can be reasonably expected to cause the failure of the life support device or system or to affect its safety or effectiveness National Semiconductor National Semiconductor National Semiconductor National Semiconductor Corporation Europe Hong Kong Ltd Japan Ltd 1111 West Bardin Road Fax 49 0 180 530 85 86 13th Floor Straight Block Tel 81 043 299 2309 Arlington TX 76017 E mail europe supp...

Reviews: