25
Using the Channel Selector allows the histogram to reflect
the distribution of brightness in an entire image or in
individual colors (Red, Green, and Blue).
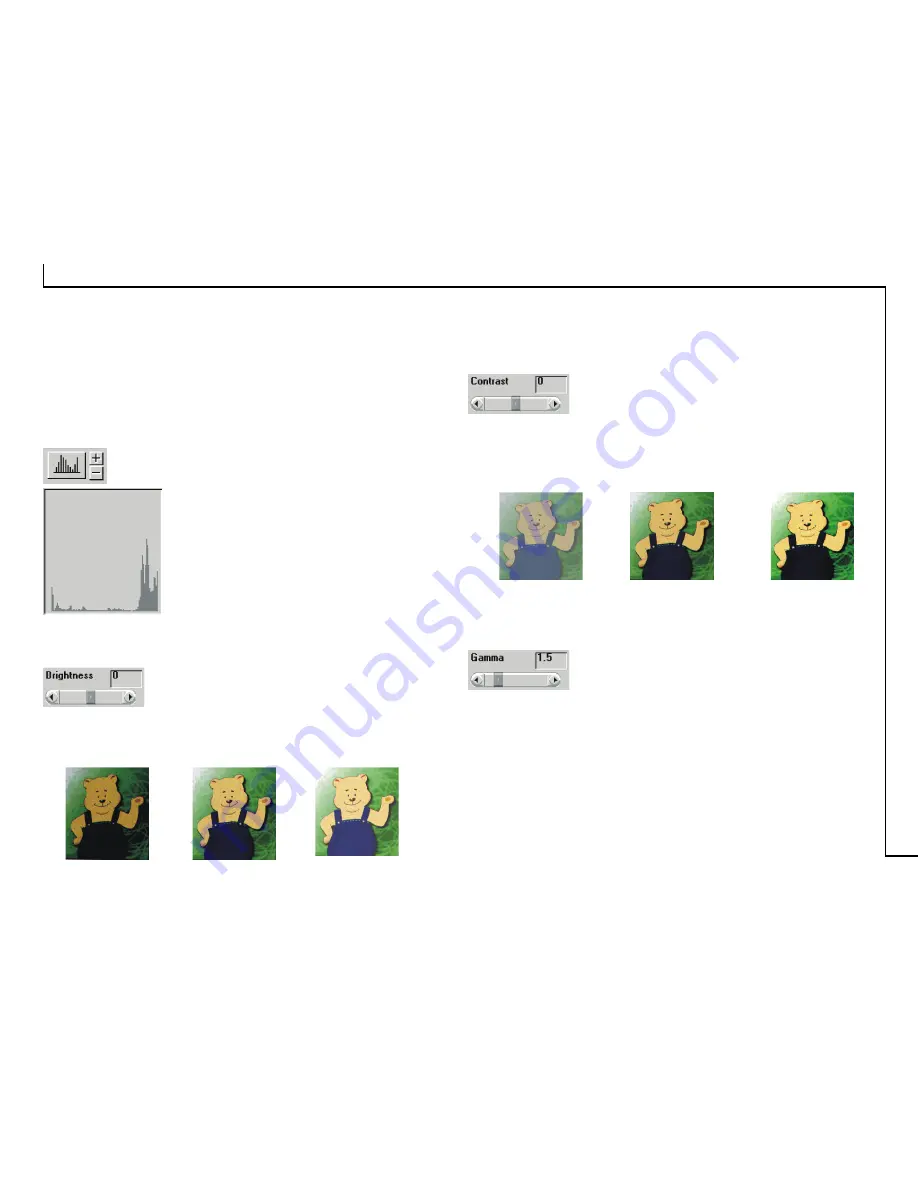
Histogram Button
The Histogram Button
allows you to view
the histogram as either a line graph or a
bar graph. As a bar graph, the horizontal
axis represents the brightness levels from
darkest (left) to brightest (right). The
vertical axis represents the amount of
pixels with that brightness level value.
To adjust the display of the histogram,
click on the Histogram button and then
click on the + or – button.
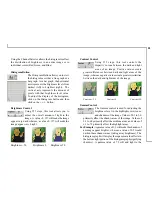
Brightness Control
Using 255 steps, this tool allows you to
adjust the overall amount of light in the
image. A value of –127 will make the image
appear very dark, whereas, a value of +127 will make the
image appear very bright.
Brightness –50
Brightness 0
Brightness 50
Contrast Control
Using 255 steps, this tool controls the
disparity in tone between the dark and light
areas of an image. Positive values create
greater differences between dark and light areas of the
image, whereas, negative values create greater similarities
between the dark and light areas of the image.
Contrast –50
Contrast 0
Contrast 50
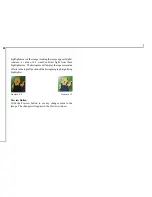
Gamma Control
The Gamma control is used for adjusting the
brightness level in the highlights, mid-tones,
and shadows of the image. Values of 0.1 to 2.0
primarily affect the shadow areas of the image. Values of
2.1 to 6.0 primarily affect the midtone areas, and values of
6.1 to 7.9 primarily affect the highlight areas.
For Example:
A gamma value of 1.9 will make the shadows of
an image appear brighter, whereas, a value of 0.2 would
darken these shadow areas (taking away brightness). The
histogram graph will display these gamma value effects in
the bottom right portion of the histogram graph (signifying
shadows). A gamma value of 7.8 will add light to the


