26
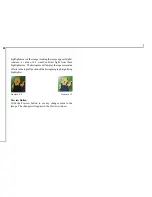
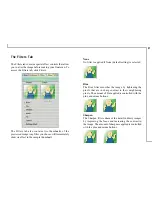
highlight areas of the image (making the image appear bright),
whereas, a value of 6.4 would subtract light from these
highlight areas. The histogram will display these gamma value
effects in the top left portion of the histogram graph (signifying
highlights).
Gamma 0.6
Gamma 1.5
Preview Button
Click the Preview button to see any changes made to the
image. The changes will appear in the Preview window.


