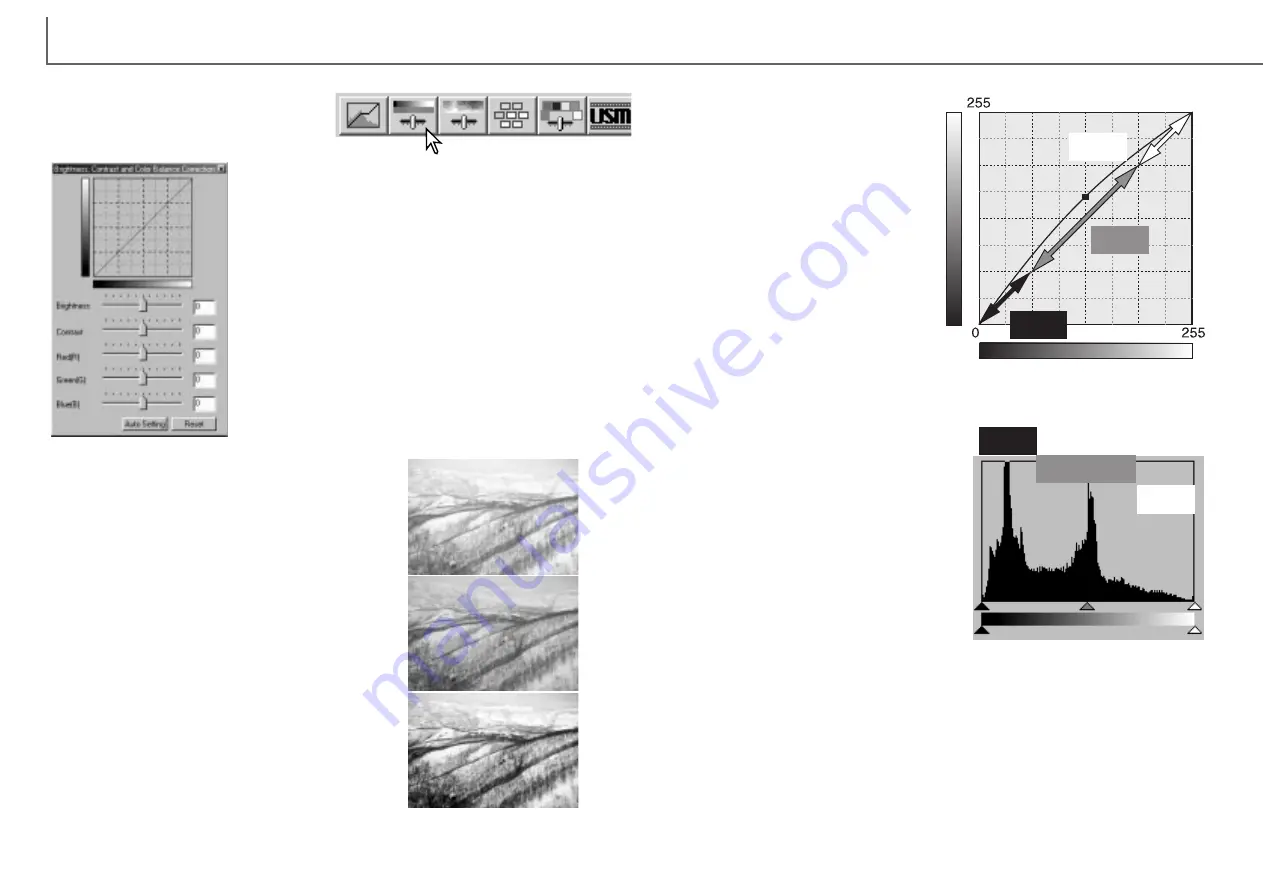
The tone curve is a graphic repre-
sentation of the brightness and color
levels of the image. The bottom axis
is the 256 levels of the original
image (input data) from black to
white. The vertical axis is the correct-
ed image (output data) with the
same scale from top to bottom.
The bottom left portion of the graph
represents the dark colors and shad-
ow areas of the image. The middle
section represents the mid-tones:
skin, grass, blue sky. The top right
section is the highlights: clouds,
lights. Changing the tone curve can
affect the brightness, contrast, and
color of the image.
Input
Output
Highlights
Mid-tones
Shadows
Shadows
71
70
Drag the brightness, contrast, or color sliders, or enter
specific values in the corresponding text box to make
corrections. Dragging each slider to the right or
inputting a positive number in the text box increases
the brightness, contrast, and color.
Changes will be reflected in the displayed image and
in the graph at the top of the palette. The horizontal
axis of the chart indicates the original image values
and the vertical axis the new values. Click the reset
button to cancel any changes.
Clicking the auto-setting button corrects the brightness
and contrast automatically without affecting the color
balance. Click the reset button to cancel the changes.
Click the brightness, contrast, color-balance
button to display the palette.
Brightness, contrast, and color balance palette
Is this picture too light? Adjusting brightness and con-
trast can be more difficult than it looks. The image on
the right looks too bright, especially the mountains in
the background.
Simply making everything darker with the brightness
controls creates a muddy image - the snow and sky are
a dull gray and there are no strong blacks.
By adding contrast to the image, the snow is brightened
while the darker trees are accentuated. The extra con-
trast also gives the image the appearance of being
sharper as well as revealing fine details.
Tone curve and histogram corrections
The histogram indicates the distribu-
tion of pixels with specific brightness
and color values in the image. Using
the histogram can maximize the out-
put of the image data. Changes
made with the histogram are also
displayed on the tone curve.
Number of pixels
Luminance levels from 0 to 255
Highlights
Mid-tones
D
IMAGE SCAN DUAL III UTILITY
-
IMAGE PROCESSING
Summary of Contents for AF-2840
Page 1: ...INSTRUCTION MANUAL E...


