Operation
27
4.2.2.3
Identifying and Locating Faults
Following the measurement, the measured values and curves can be examined for any
conspicuous jumps and thus the triggering or subsiding of the fault at a certain
measuring current value can be detected.
As is the case even during the measurement, different diagram types can be switched
between using the
menu item (see also the previous page).
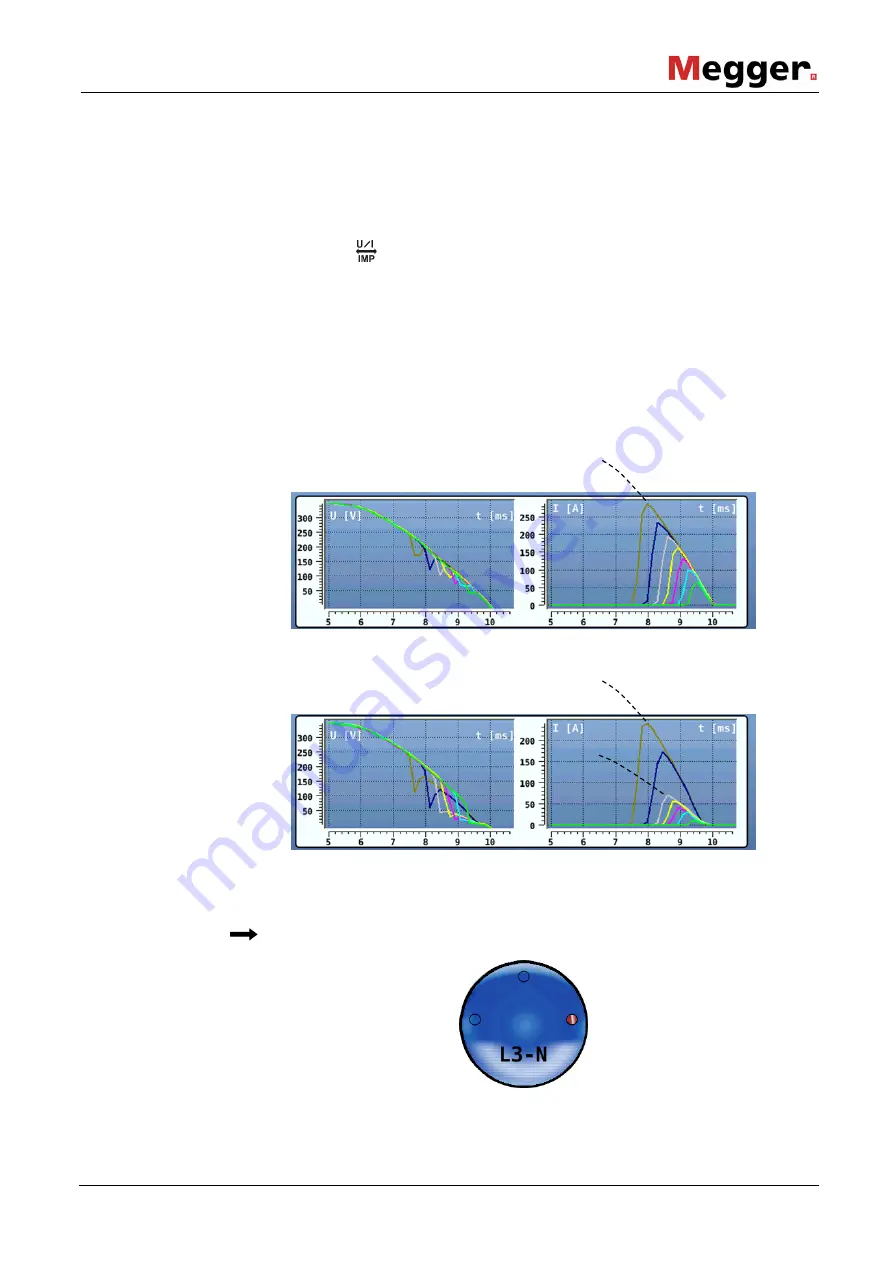
The curve of current and voltage in particular can be very useful when it comes to
identifying a fault. The following applies in principle: As soon as a fault has been tripped
in the course of the measurements, this is marked by diverging envelope curves.
This is very easy to see in the current curve in the example depicted below. While in the
case of the inconspicuous measurement the envelope curve (broken black line) is
identical for all curves, in the case of the faulty phase two different envelope curves are
clearly recognisable.
In order to be able to undertake a comparison between the measured conductors when
measuring multiple conductors, the following selection menu must be called up via the
menu item:
The conductor to be displayed is selected by turning the rotary encoder.
Comparing curves
Inconspicuous measurement:
Conspicuous measurement:
Summary of Contents for NIM 1000
Page 1: ...1 NIM 1000 Net Impedance Meter USER GUIDE Issue 04 06 2016 EN Article number 82941 ...
Page 2: ...2 ...
Page 6: ......


